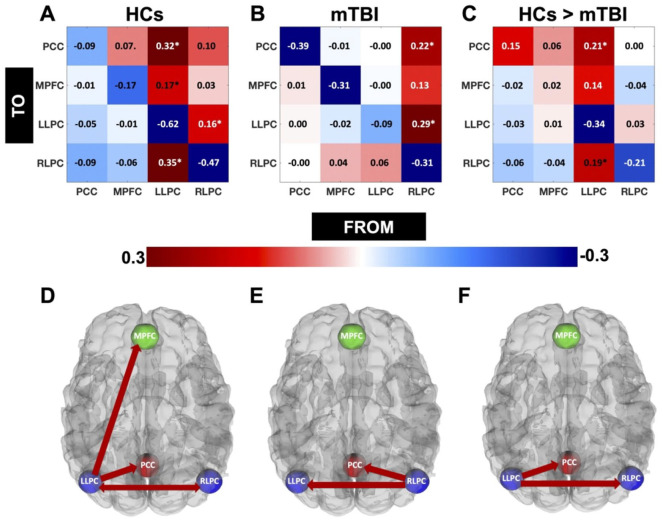
Figure 1.
EC for HCs and individuals with mTBI. Here we showed the subject average EC strength (in Hz) of all the connections within the DMN for HCs (A) and post mTBI (B). Positive and negative values here represent the exhibitory and inhibitory connections respectively. In Figure 1C, we showed the comparisons of EC strengths between HCs and post mTBI. The positive values here represent the connections that are stronger in HCs than post mTBI, whereas the negative values here represent the connections that are weaker in HCs than post mTBI. Connections exceeding the Pp of 95% are indicated by “*” in Figure 1(A to C), and are shown in Figure 1D (HCs), 1E (mTBI), and 1F (HCs > mTBI).

