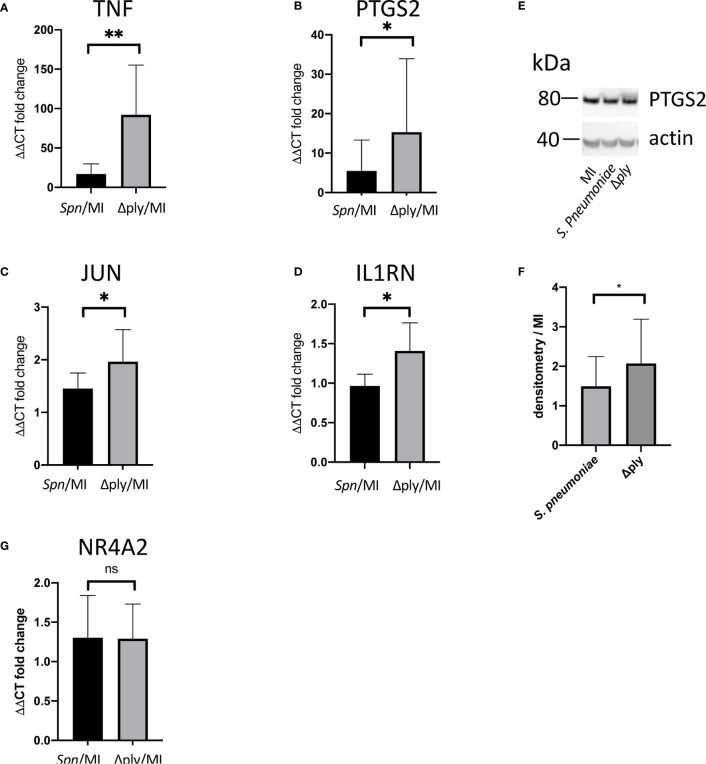
Figure 3.
Pneumolysin leads to repression TNF and PTGS2 production. Monocyte derived macrophages (MDMs) were challenged with either S. pneumoniae, the isogenic pneumolysin negative mutant (Δply), or mock-infected with phosphate buffered saline (MI). After 3 h incubation RNA was extracted from MDMs and RT-qPCR performed to measure the abundance of (A) TNF, (B) PTGS2, (C) C-JUN, (D) IL1RN and (G) NR4A2 mRNA. The Bar chart represents the ΔΔCT fold change for each bacterial challenge demonstrating significantly higher abundance of TNF, PTGS2, C-JUN and IL1RN mRNA following challenge with Δply. (G) There was no significant difference in the abundance of NR4A2 mRNA in response to either bacterial challenge. (E) A representative western blot after probing with anti-PTGS2 antibody is shown, with actin used as a loading control. The blot is representative of four independent experiments. (F) Densitometry was performed to estimate the PTGS2/actin and normalised to mock infected sample. The bar charts represent mean and Standard Deviation, n= 10 for panel (A, B). n=6 for panel (C) and n=7 for panel (D, G); *p < 0.05, **p < 0.01.

