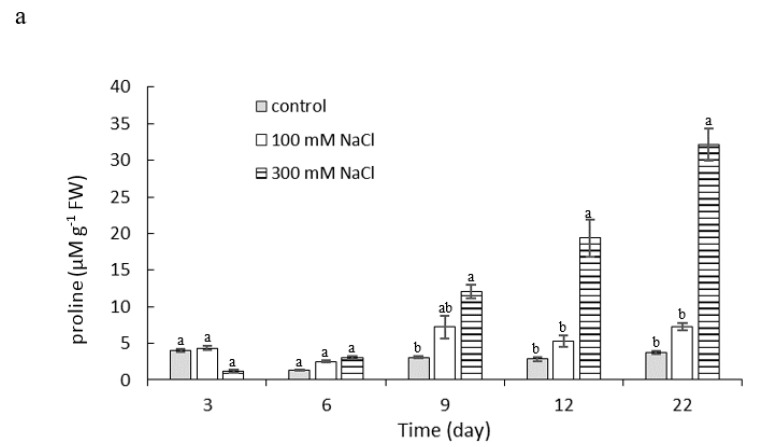
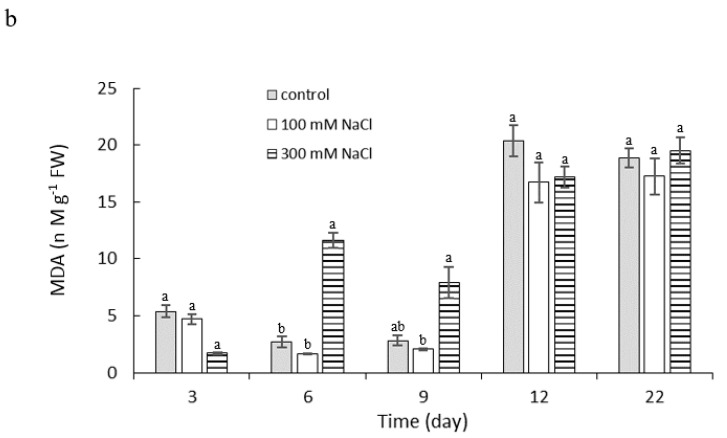
Figure 5.
(a) Proline and (b) MDA content in leaves of P. oleracea under salt stress with 100 mM or 300 mM NaCl. Means ± SE; n = 3; one-way ANOVA with Tukey’s post hoc test; (a) F(8, 207) = 44.276; p = 0.0001; (b) F(12, 81) = 6.220; p = 0.0001. For each time point, the columns with different letters indicate significant difference at p < 0.05.


