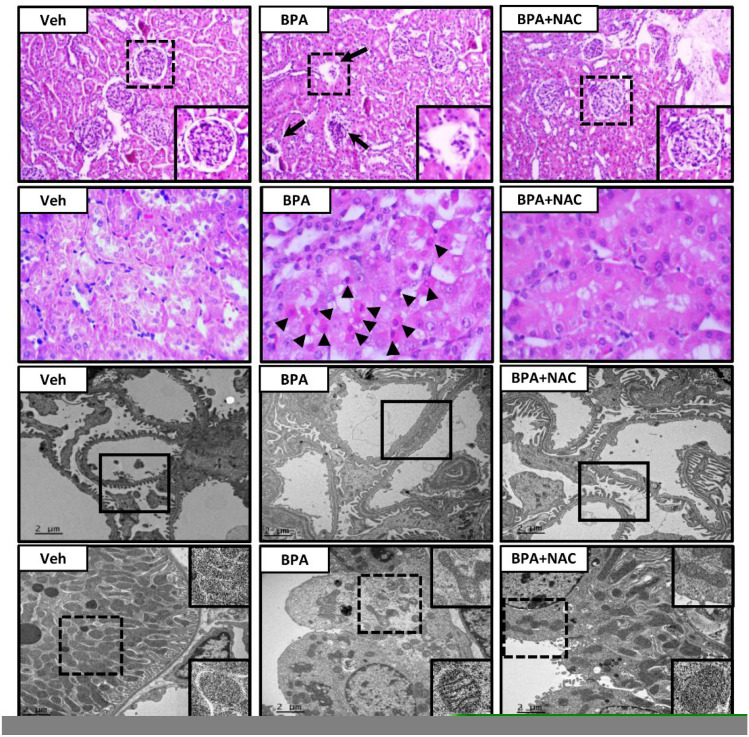
Figure 2.
Histopathological changes following long-term BPA exposure and NAC treatment. The first and second panels show kidney sections stained with hematoxylin and eosin (H&E, 10× and 40×, respectively). The third and last panels show transmission electron micrographs of glomerulus and renal tubules, respectively (Original magnification: 3000×). Veh: vehicle-treated group; BPA: BPA-treated group; BPA + NAC: BPA plus NAC-treated group. Arrows and arrowheads show abnormal glomerulus and apoptotic cells, respectively. The inserted frame is enlarged from the dashed area. The squares within the third panel highlight the morphology of the podocytes, especially the podocyte effacement in the BPA-treated group.

