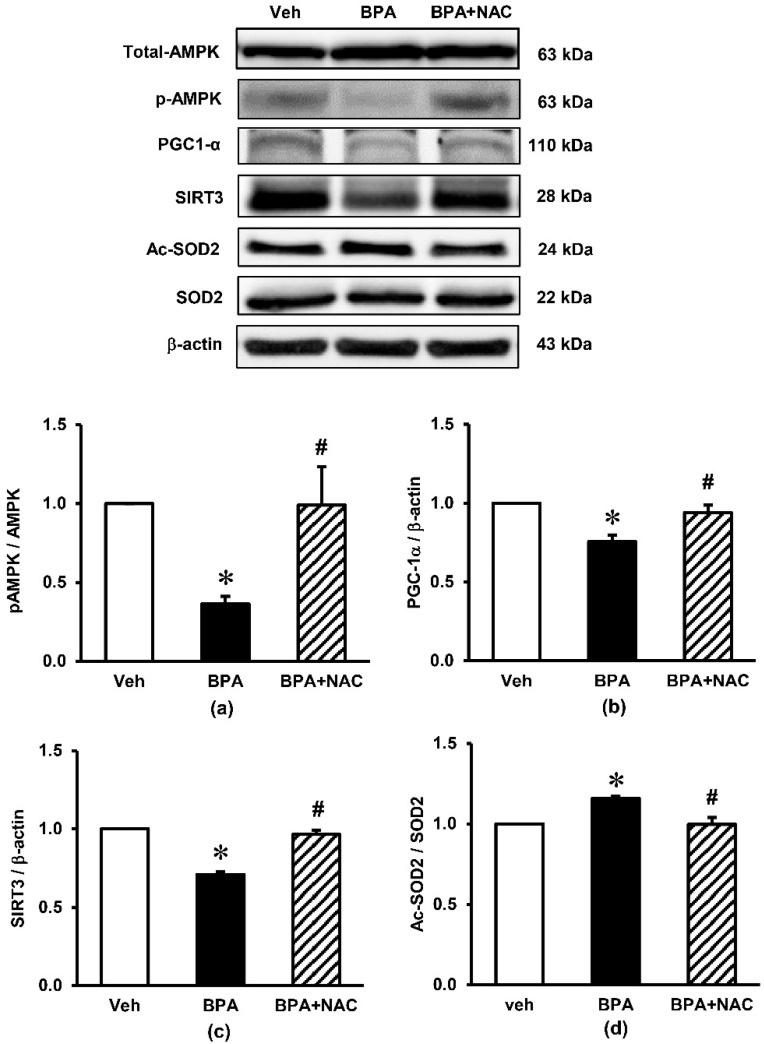
Figure 6.
Effects of long-term BPA exposure and NAC treatment on renal cortical expressions of signaling proteins involved in the AMPK-SIRT3-SOD2 axis. (a) pAMPK/AMPK; (b) PGC-1α/β-actin; (c) SIRT3/β-actin; (d) Ac-SOD2/SOD2. Values are mean ± SEM (n = 4). Veh: vehicle-treated group; BPA: BPA-treated group; BPA + NAC: BPA plus NAC-treated group. * p < 0.05 vs. Veh, # p < 0.05 vs. BPA.

