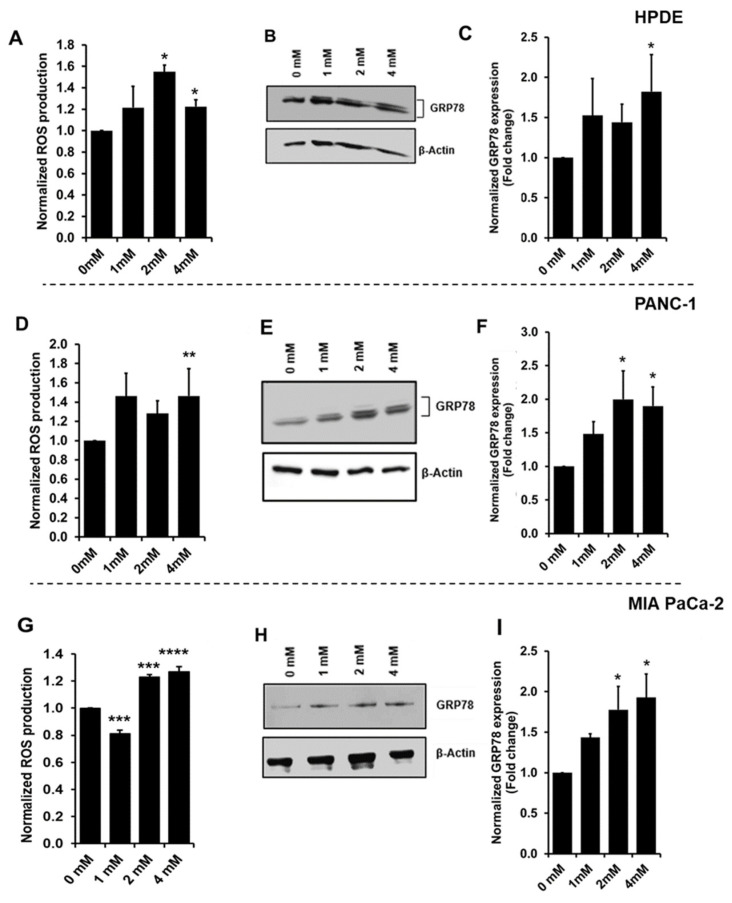
Figure 2.
Oxidative Stress in HPDE, PANC-1, and MIA PaCa-2 cells treated with glyceraldehyde for 48 h. (A,D,G) ROS production determined as fluorescence of 2′, 7′-dichlorofluorescin (DCF) production. Data were normalized to cell viability. (B,E,H) Western blot for GRP78 expression in cells treated with glyceraldehyde. (C,F,I) Quantitative analysis of GRP78 expression in cells treated with glyceraldehyde. Data were normalized to control (0 µM). Data represent the mean (n = 3) ± SE. **** p < 0.0001, *** p < 0.001, ** p < 0.01, * p < 0.05 vs. control (0 mM).

