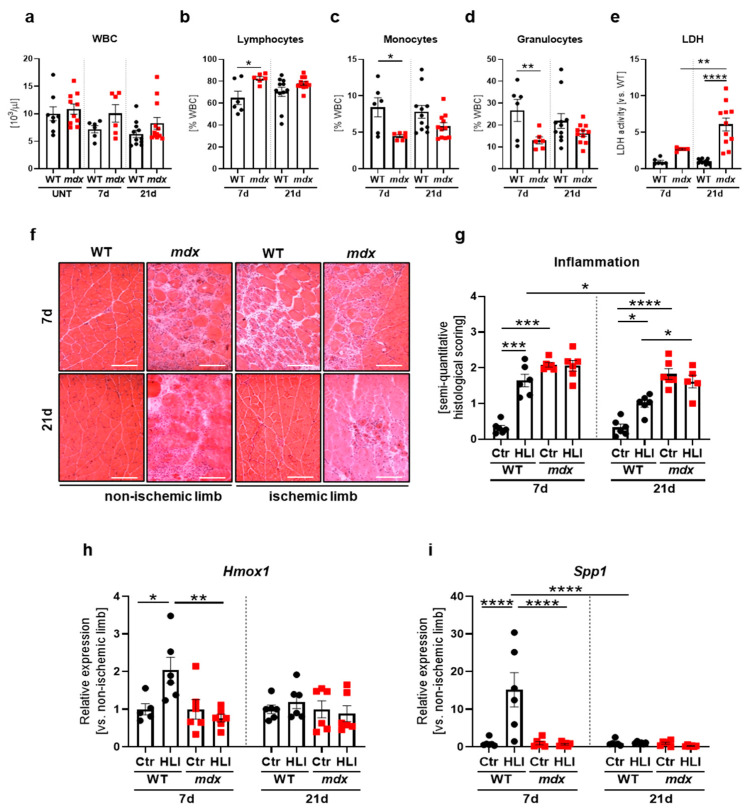
Figure 7.
Inflammation markers following a hindlimb ischemia (HLI) procedure in 12-week-old dystrophic and WT animals. (a) The number of white blood cells (WBC) and (b) the percentage of lymphocytes, (c) granulocytes, and (d) monocytes assessed in the peripheral blood of WT and mdx mice, 7 and 21 days after HLI and in untreated (UNT) WT and mdx mice in case of WBC; blood cell count; n = 6–12/group. (e) Lactate dehydrogenase (LDH) release to serum analyzed 7 and 21 days after HLI in WT and mdx animals; activity assay; n = 6–12/group. (f) Representative pictures of hematoxylin and eosin staining of the gastrocnemius with (g) semi-quantitative histological scoring of inflammation in the non-ischemic and ischemic leg of WT and mdx mice, 7 and 21 days after HLI; microscopic assessment using a Nikon Eclipse microscope. Scale bar: 100 μm; n = 5–6/group. The expression of (h) Hmox1 and (i) Spp1 in the gastrocnemius of WT and mdx animals 7 and 21 days after HLI; qRT-PCR; n = 5–6/group. The results are presented as mean ± SEM. * p < 0.05, ** p < 0.01, *** p < 0.005, **** p < 0.0001 by one-way ANOVA with Tukey’s posthoc test.

