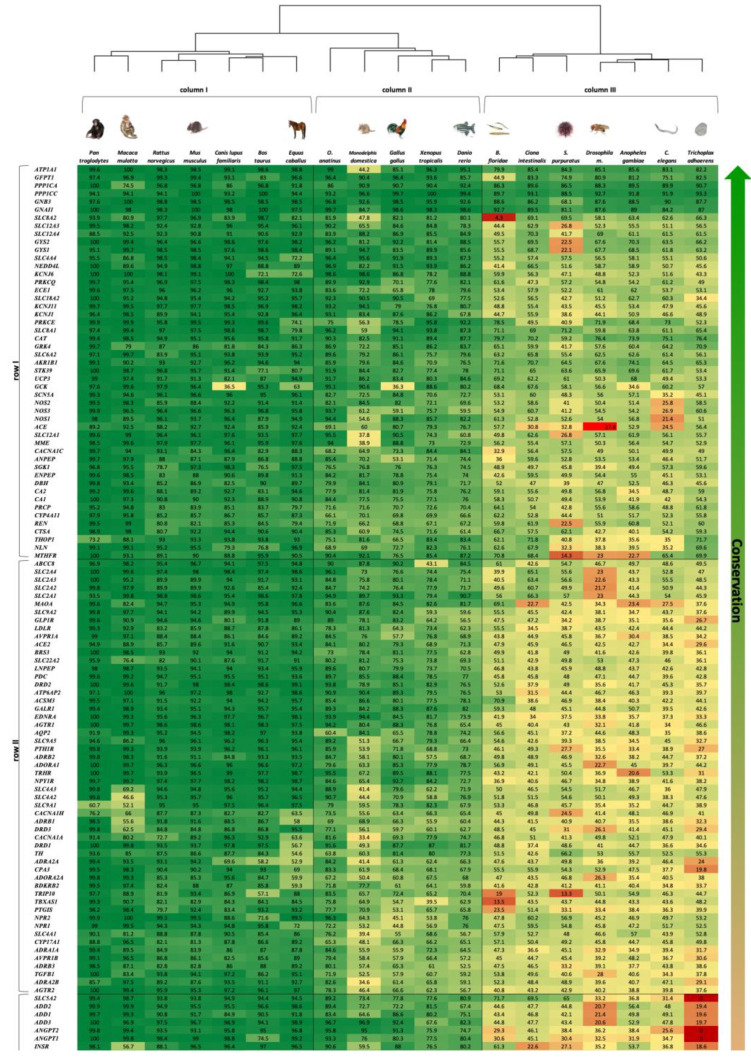
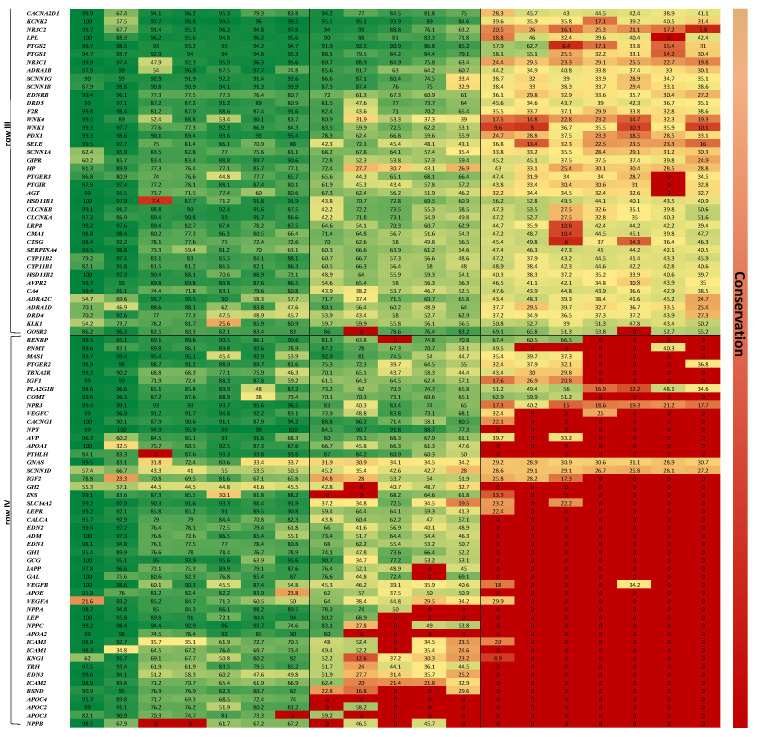
Figure 1.
Heatmap displays the hierarchical clustering of similarity percentage scores between human BP genes (vertical axis) and their orthologs in 19 organisms (horizontal axis). Green color denotes the more conserved genes across the 19 organisms, aligned at the top of the map (see conservation scale arrow to the right of map). A phylogenetic tree describing the developmental order is placed above the map.


