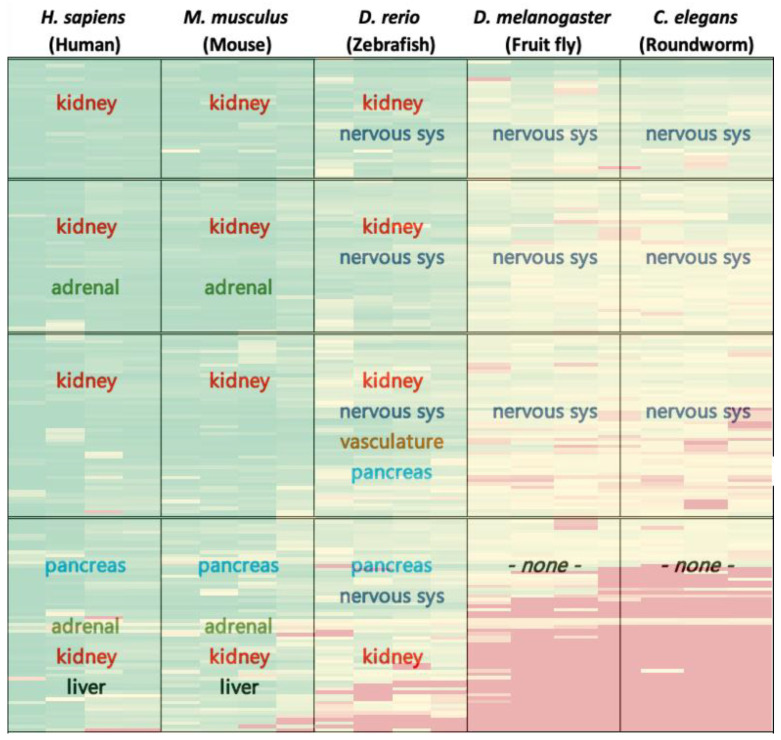
Figure 3.
Demonstrates a summary of expression analysis results overlaid on heatmap of Figure 1. In each box, results pertain to the enriched organ/tissue expression for the respective genes-organisms of the cluster. For ease of interpretation, colored text represents tissue/organ types, reflecting their distribution throughout the map. For full functional analysis results please refer to Supplementary Table S2.

