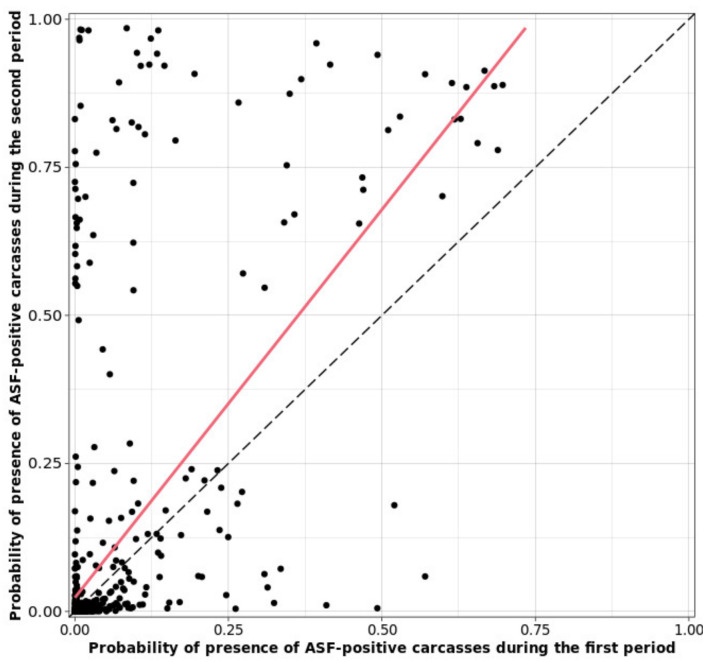
Figure 6.
Scatter plot for the relationship between the probability of presence of ASF-positive wild boar carcasses for the first and second periods. Red line indicates the positive relationship between the probabilities of presence of ASF-positive carcasses for the two periods. Black dashed line indicates the diagonal line to help to understand the relationship between the probabilities of the two periods.

