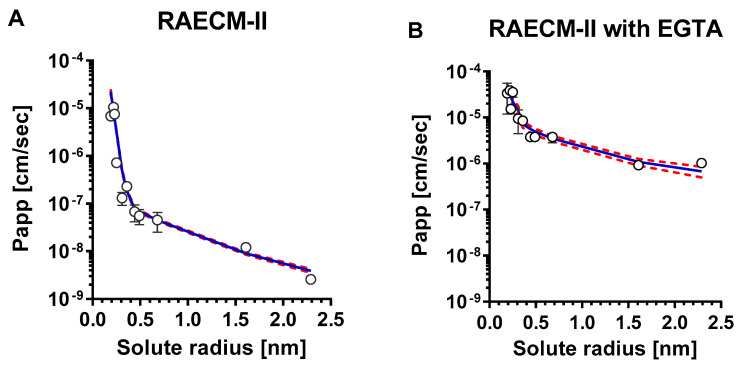
Figure A2.
Mean values of Papp versus corresponding solute radius across RAECM-II in the absence (A) and presence (B) of EGTA were analyzed using a maximum likelihood optimization approach, yielding small and large equivalent pore characteristics shown in Table A5. Circles represent mean Papp and solid curve in blue denotes the heteropore characteristics that best fit the observed mean Papp versus corresponding solute radius data. Standard deviation for each mean Papp is also shown. Red dotted curves represent solid blue curve ± standard errors.

