
Figure 10.
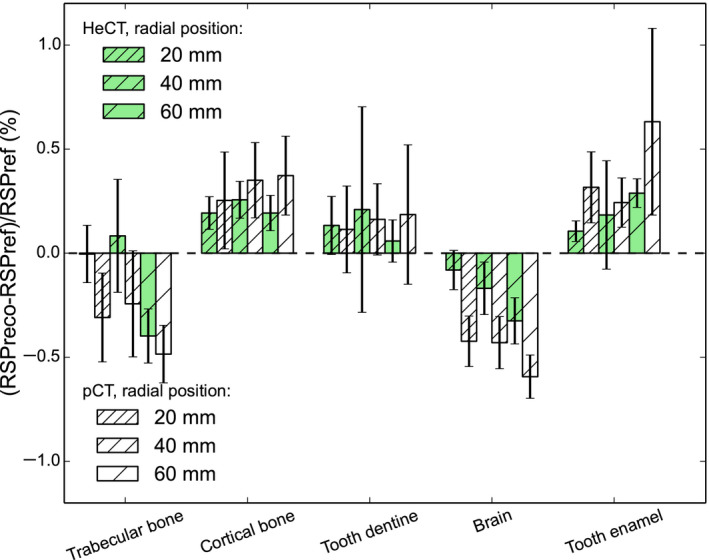
Error comparison for the reconstructed RSP values of the inserts in the IP3 phantom for HeCT (green bar) and pCT (white bar) for inserts at different distances from the phantom center, which correspond to the isocenter. The error bars represent the percentage relative standard deviations. The different shades represent the distances of the inserts along the radial dimension (20, 40, or 60 mm). [Color figure can be viewed at wileyonlinelibrary.com]