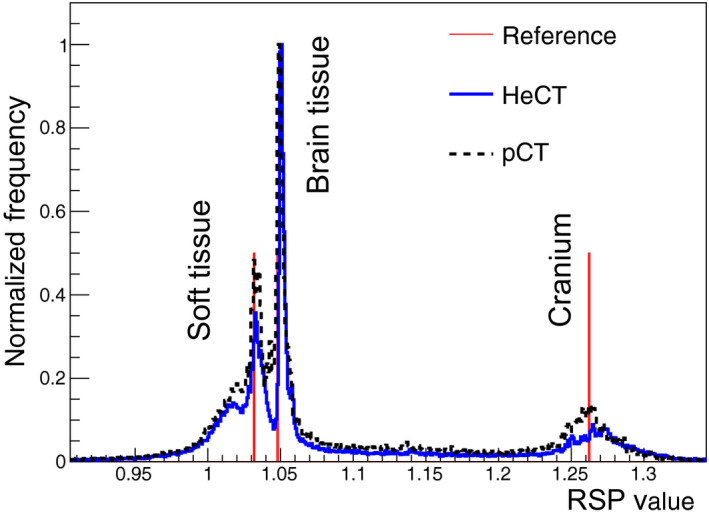
Figure 13.

RSP‐value frequency distributions for the HeCT (solid blue line) reconstructed head phantom compared to pCT (dashed black line) and to the reference values (red lines). The normalization is such that the maximum frequency for brain tissue is unity. For the reference values, the vertical lines only indicate the value of the RSP, not the frequency. [Color figure can be viewed at wileyonlinelibrary.com]
