
Figure 15.
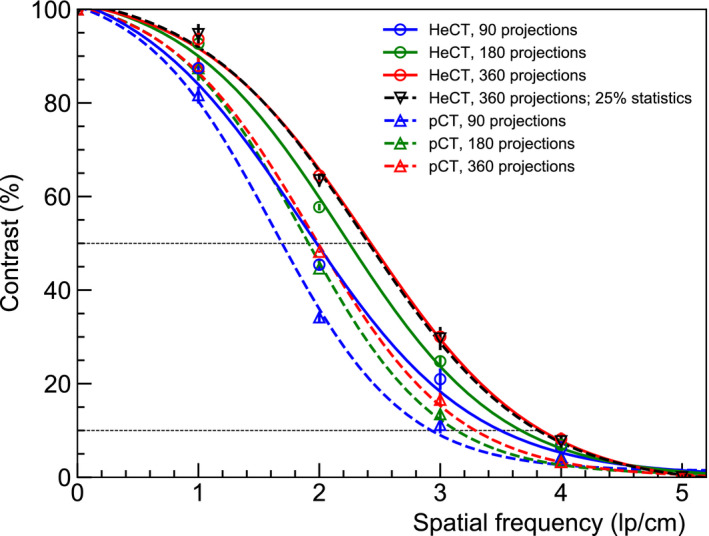
MTF for of HeCT (solid) and pCT (dashed) evaluated through the CTP528 phantom. The tomographic scans were acquired using 90 (red), 180 (green), and 360 (blue) projection angles. A regression to a sigmoid was performed to suppress noise. The black dashed line represents the MTF for the HeCT reconstruction image using only 25% of the original statistics. [Color figure can be viewed at wileyonlinelibrary.com]