Fig. 5.
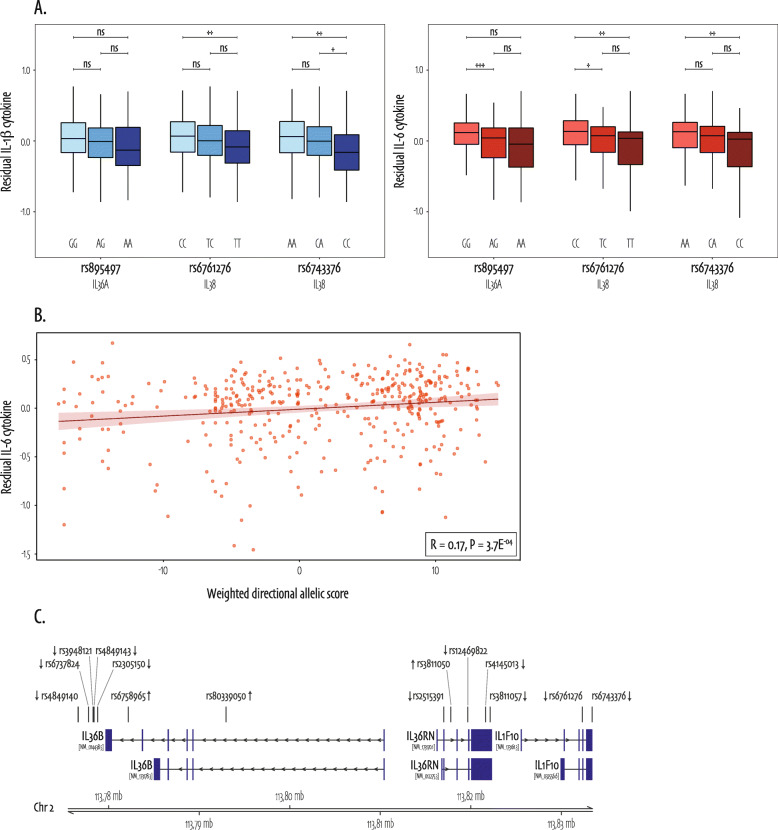
Coding and non-coding common variant set associations with C. albicans-induced cytokine production. a Residual (corrected for age and sex) IL-1β (left in blue) and IL-6 (right in red) cytokine production for coding SNPs in IL36A and IL38 decreases over the genotype categories. For all plots, the ancestral allele is the minor allele and thus the genotype categories are ordered from left to right: homozygous alternative (IL-1β in light-blue and IL-6 in light-red), heterozygous (IL-1β in mid-blue and IL-6 in mid-red), homozygous ancestral (IL-1β in light-blue and IL-6 in light-red). Significant Wilcoxon rank sum P values are observed for IL-1β rs6761276 CC vs TT = 0.008, IL-1β rs6743376 AA vs CC = 0.001, IL-1β rs6743376 CA vs CC = 0.04, IL-6 rs895497 GG vs AG = 8.2E-04, IL-6 rs6761276 CC vs TC = 0.01, IL-6 rs6761276 CC vs TT = 0.005, and IL-6 rs6743376 AA vs CC = 0.003. Annotation: * = Wilcoxon rank sum P value < 0.05; ** = Wilcoxon rank sum P value < 0.01; *** = Wilcoxon rank sum P value < 0.001. b Visualizes the significant Bonferroni-adjusted association between coding and non-coding common variants in IL38 variants and C. albicans-induced IL-6 cytokine production by means of a weighted, directional, allelic score summarizing the combined effect of all variants in the set in correlation with IL-6 cytokine. The straight line represents the linear model equation using method “lm”’ with standard error of 0.95, and the R of 0.17 represents the Spearman correlation coefficient with accompanying P value = 3.7E−04. c All common and non-coding SNPs with significant linear model P values (15 out of 41) are shown on top of transcripts that fall in the region of our IL38 (gene name IL1F10) set

