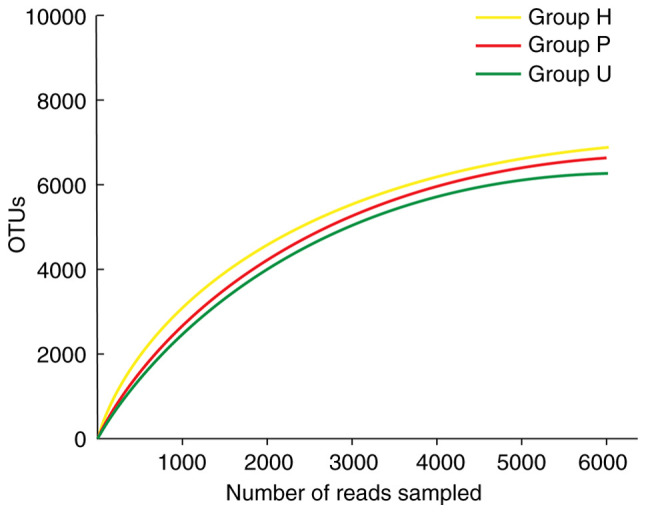
Figure 2.

Rarefaction curves of three groups. With the increase of sequencing number of the three groups of samples, the dilution curve gradually increased. When the number of sequencing exceeded 3000, the dilution curve reached the plateau stage, indicating that the sequencing depth had basically covered all species in the sample, and the sampling and sequencing results could reflect the real microbial community status of the obtained samples. OTUs, operational taxonomic units; H, healthy control; P, prepared porcelain veneers; U, unprepared porcelain veneers.
