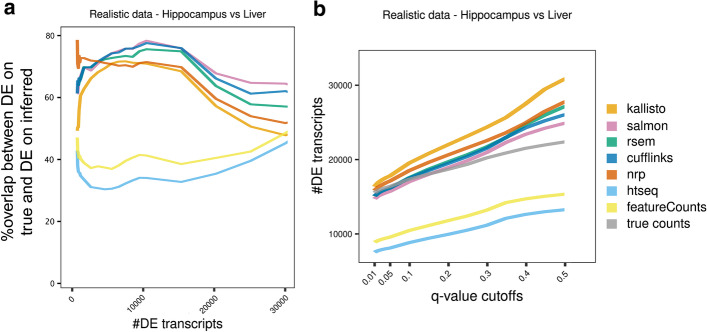
Fig. 10.
Method effect on differential expression analysis, using realistic data. For each method, a DE analysis with EBSeq was performed between the two tissues. A A point (x,y) on a curve means that the top x DE transcripts using true counts, and the top x DE transcripts using the inferred quants, have Jaccard index y. B A point (x,y) on a curve means there are y isoforms with q-value < x. The curves should be evaluated in relation to the truth, which is the gray curve. At varying q-value cutoffs between 0.05 and 0.2 all methods become anti-conservative. Salmon and Cufflinks track the truth closest at small cutoffs

