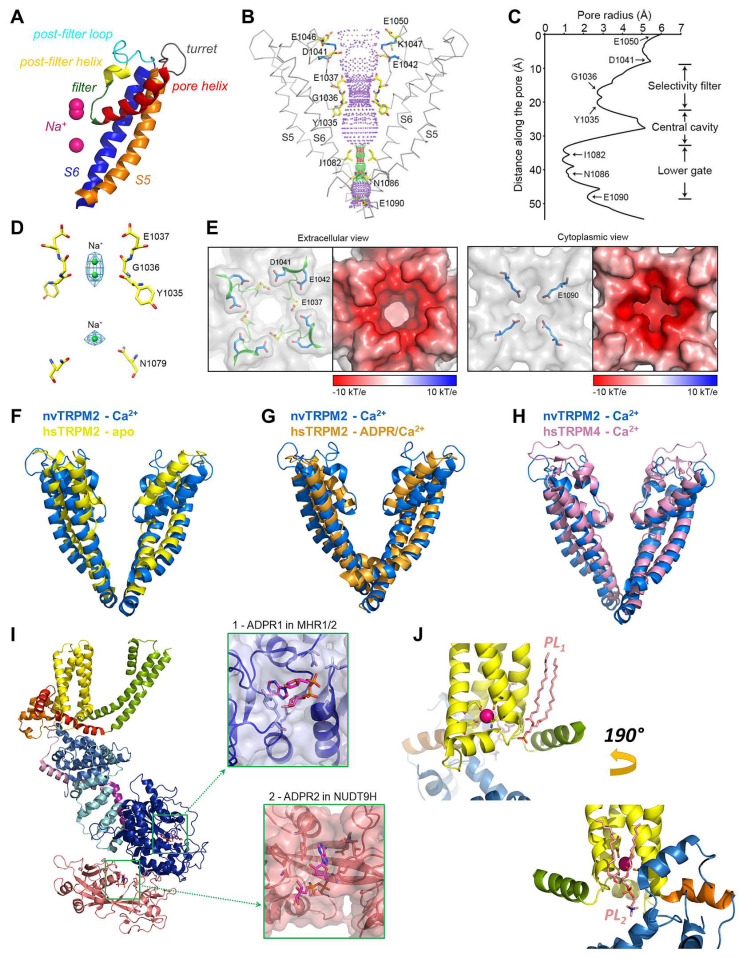
Figure 4.
The pore and ligand-binding sites of TRPM2. (A) Cartoon representation of pore-domain segments of nvTRPM2 with modeled Na+ ions (purple spheres) (6co7, (A–E)). (B) Internal surface of the pore (purple dotted mesh) indicating restrictions (red, radius < 1.15 Å and green, radius 1.15 to 2.30 Å). Pore-lining residues are shown in stick representation with elementary color coding (The PyMOL Molecular Graphics System, Version 2.0 Schrödinger, LLC.). (C) Van der Waals radius of the pore along its central axis. (D) Na+ ions (green spheres) modelled into densities (blue mesh) observed in the selectivity filter and the central cavity. (E) Surface electrostatics of the outer (left panel) and inner pore (right panel) vestibules. Left insets: pore residues are highlighted within surface representation; right insets: surface electrostatics, negative (red) to positive (blue), calculated at pH 7. (F–H) Superpositions of the pore region of nvTRPM2 (6co7, blue) with those of apo hsTRPM2 (6puo, yellow), ADPR/Ca2+-bound hsTRPM2 (6pus, orange), and Ca2+-bound hsTRPM4 (6bqv, pink). (I) Protomer of hsTRPM2 (6pus), color-coded as in Figure 3C. Insets show expanded views of the ADPR1 and ADPR2 ligand binding sites (MHR1/2 and NUDT9-H, respectively). (J) Phospholipid (PL, salmon sticks) binding to the vanilloid-type (top panel) and the preS1-VSLD-TRPH site (bottom panel) in nvTRPM2 (6co7). Sticks are shown for residues on S2 and S3 that coordinate the Ca2+ ion (magenta sphere). Panels (B–E) were adapted from [33].

