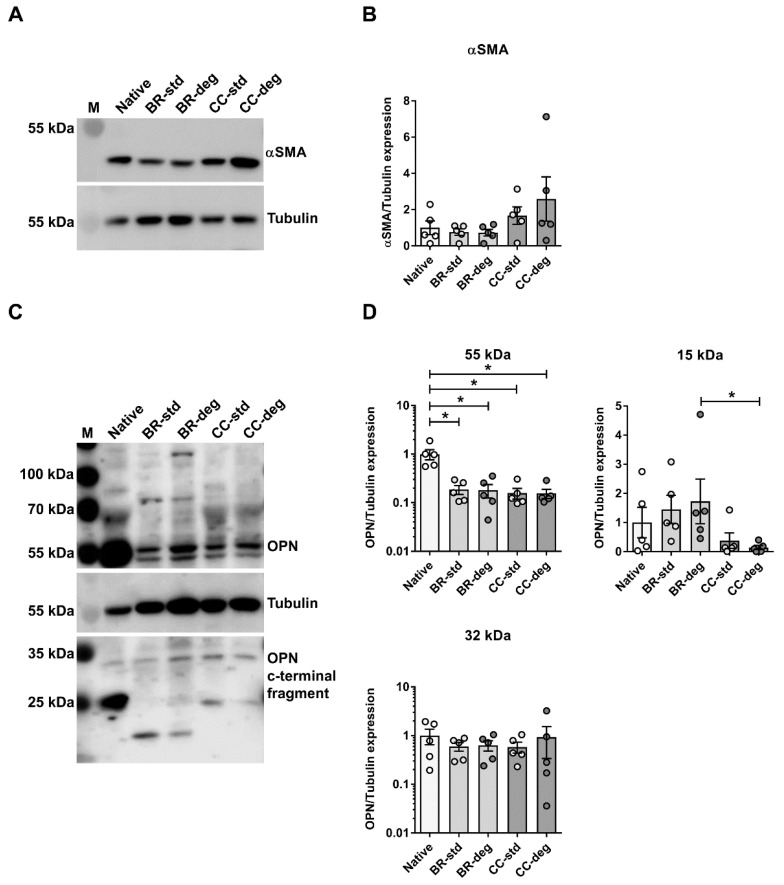
Figure 6.
Bioreactor cultivation led to altered OPN protein levels. Lysates were analyzed by Western blot with specific antibodies for (A,B) αSMA, (C,D) osteopontin (OPN), and Tubulin as loading control. Positions of molecular weight markers are indicated on the left. (B,D) Graphic representation of band intensities is displayed on the right, using means and standard error of means (n = 5). For OPN protein bands at approximately 55 kDa and 32 kDa were subjected to intensity analysis. Kruskal–Wallis test was performed and significance of Dunn’s post-test is indicated with stars (* p < 0.05). Control: native leaflets, BR: bioreactor cultivation, CC: static cultivation in cell culture, std: using standard medium, deg: using pro-degenerative medium.

