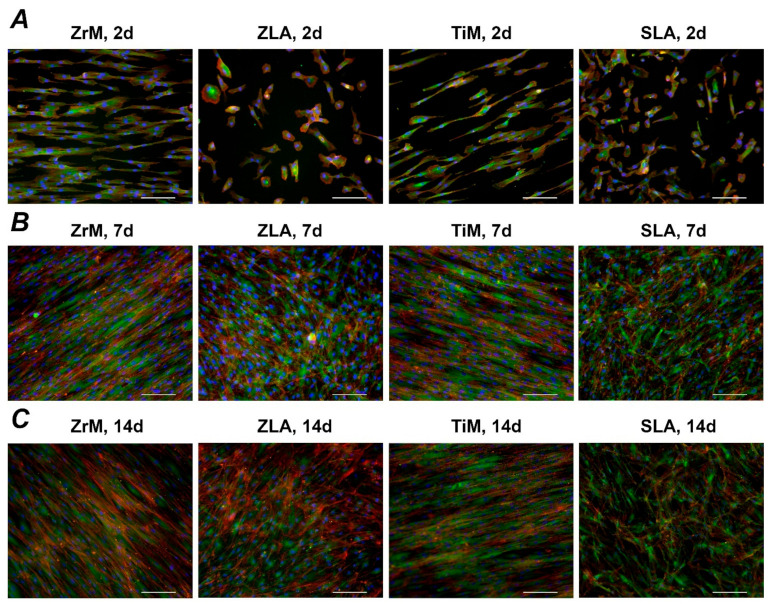
Figure 3.
Fluorescence microscopy images of primary hGFs cultured on a smooth machined ZrO2 surface (ZrM); a moderately rough ZrO2 surface (ZLA); smooth machined Ti surface (TiM); a moderately rough, sand-blasted, large grain acid-etched Ti surface (SLA). Cell culture was performed for 2 (A), 7 (B), and 14 (C) days; F-actin was stained with TRITC-conjugated Phalloidin (red), focal adhesions with anti-Vinculin visualized by fluorescein isothiocyanate (FITC) (green), and the nucleus with 40,6-Diamidin-2-phenylindol (DAPI) (blue). Scale bars correspond to 100 µm.

