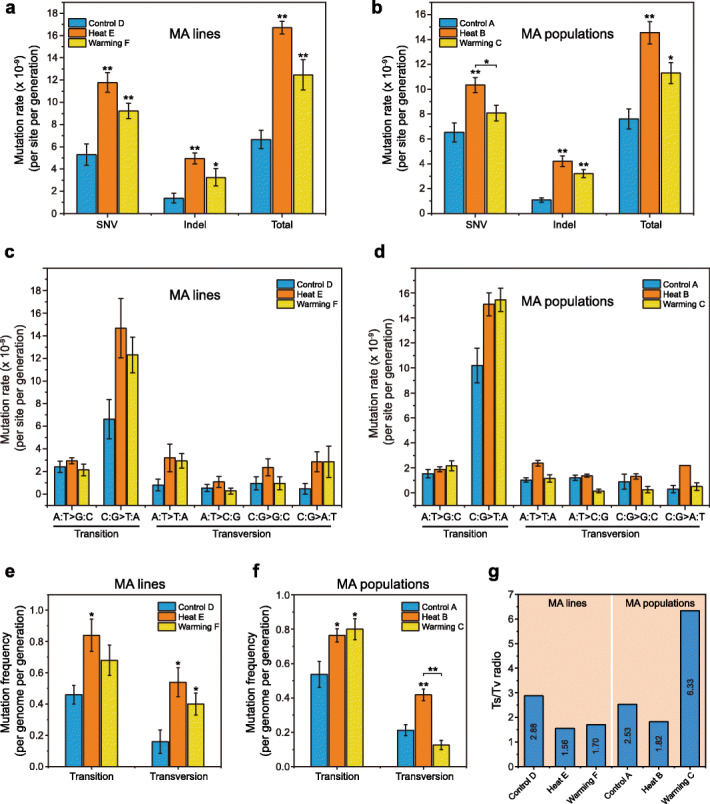
Fig. 3.

Estimation of mutation rates of observed mutations (SNVs, indels) and molecular spectra in Control, Warming, and Heat MA lines and populations. a, b SNV, indel, and total mutation rates (per site per generation) of de novo mutations in MA lines and populations subjected to different temperature treatments. Significant differences were revealed using a two-tailed Student’s t test (*p < 0.05, **p < 0.01 compared to the Control or Warming treatments). c, d Mutation rates of different mutation types in MA lines and populations subjected to different temperature treatments. Conditional rates of each mutation type per site per generation were estimated by dividing the number of observed mutations by the number of analyzed sites capable of producing a given mutation and the number of generations of MA in each Control, Warming, and Heat lineage and population lineage. Error bars indicate SEM. e, f Mutation frequencies (per genome per generation) of transition and transversion mutations accumulated in MA lines and populations subjected to different temperature treatments. Significant differences were revealed using a two-tailed Student’s t test (*p < 0.05, **p < 0.01 compared to the Control or Warming treatments). g Transition/transversion ratios (Ts/Tv) of SNVs accumulated in MA lines and populations subjected to different temperature treatments
