Fig. 6.
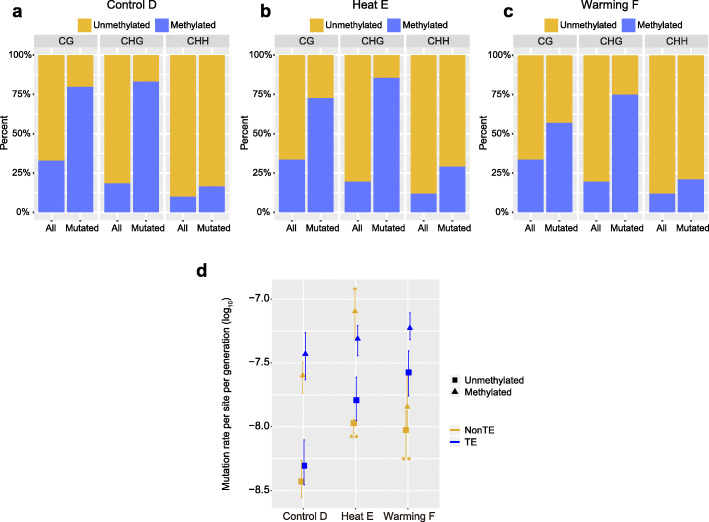
Estimation of the effects of cytosine methylation and TE region on mutation rates in the Control, Heat, and Warming MA lines. a–c Comparison of cytosine methylation percentages at all bases in the genome and mutated bases in the Control D (A), Heat E (B), and Warming F (C) lines. H refers to A, T, or G. The methylation percentage is much higher at mutated bases than the corresponding genome-wide occurrence for all three contexts: CG (Fisher’s exact test, p = 4.58 × 10⁻⁸), CHG (Fisher’s exact test, p = 1.92 × 10⁻²¹), and CHH (Fisher’s exact test, p = 1.63 × 10⁻³). d Effects of cytosine methylation and TE region on mutation rates in the Control D (D), Heat E (E), and Warming F (F) lines. The x axis shows log-transformed (log10) mutation rates per site per generation. Mutation rates for non-TE and TE positions are marked in orange and blue, respectively. Mutation rates for nonmethylated and methylated CG positions are indicated with triangles and squares, respectively. Differences in mutation rates among Control D, Heat E, and Warming F lines were assessed using Student’s t test. Error bars indicate SEMs. Asterisks indicate significant differences from Control D at p < 0.05 (*) and p < 0.01 (**), respectively

