. 2019 Dec 9;11(4):1122–1131. doi: 10.1039/c9sc04189c

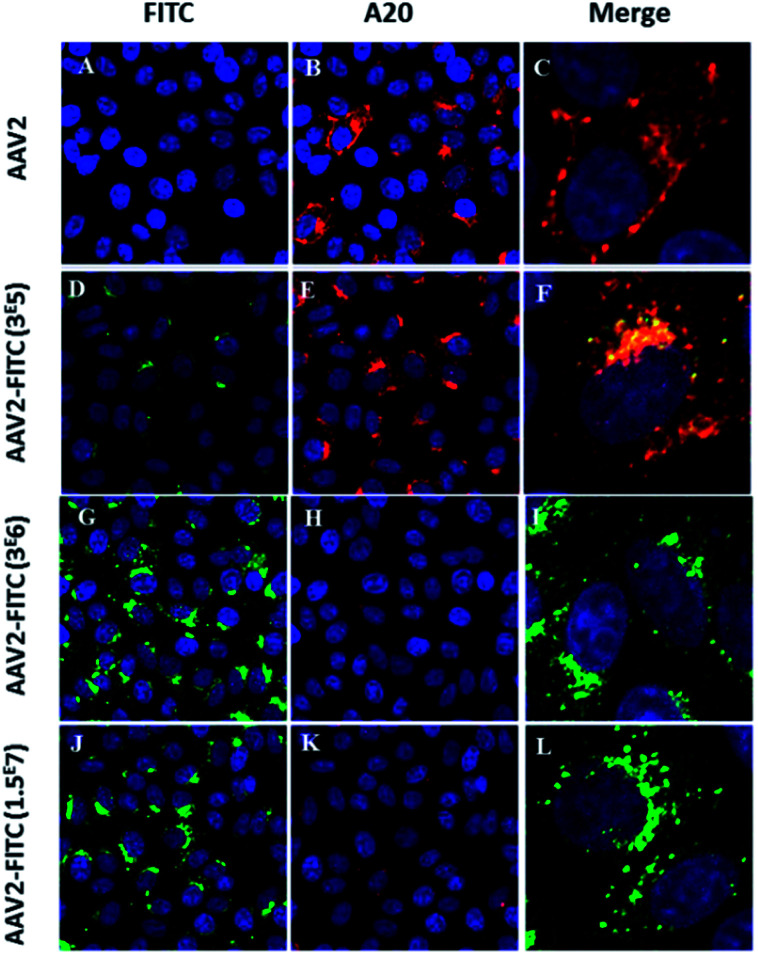
Fig. 3. Confocal imaging of modulated AAV2-FITC. (A–C) HeLa cells transduced with AAV2 and incubated with A20 primary antibody and Al647 secondary antibody. Red fluorescence from A20 immunolabeling (B) was detected. (D–F) HeLa cells transduced with AAV2-3 × 10⁵ FITC and incubated with A20 primary antibody and Al647 secondary antibody. Green FITC fluorescence (D) and red fluorescence from A20 immunolabeling (E) were detected. Colocalisation of FITC and A20-Al647 (F). (G–I) HeLa Cells were transduced with AAV2-3 × 10⁶ FITC and incubated with A20 primary antibody and Al647 secondary antibody. Green FITC fluorescence from AAV2-3 × 10⁶ FITC was detected (G) whereas the detection of red fluorescence from A20 immunolabeling was very low (H). (J–L) HeLa cells were transduced with AAV2-1.5 × 10⁷ FITC and incubated with A20 primary antibody and Al647 secondary antibody. Green FITC fluorescence from AAV2-1.5 × 10⁷ FITC was detected (J) whereas the detection of red fluorescence from A20 immunolabeling was very low (L). Cell nuclei were counterstained with DAPI (blue); scale bars: 25 μm for FITC and A20 images; 5 μm for merged images. All the controls are detailed in the ESI..

Fig. 3