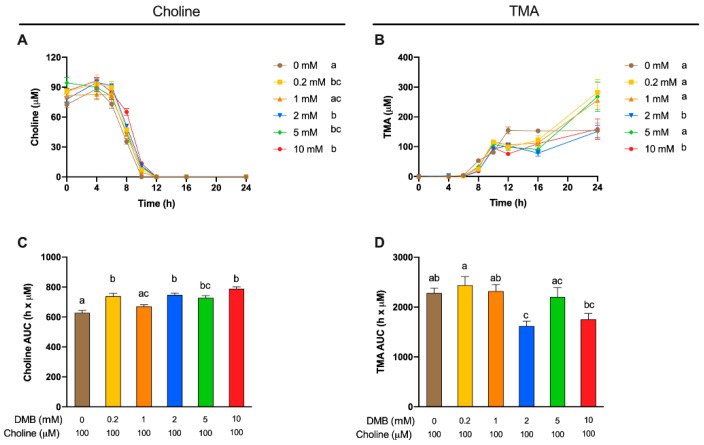
Figure 4.
Choline (A) and TMA (B) kinetic curves obtained from fermentations with fecal slurry 20%, choline 100 µM and DMB concentrations of 0–10 mM. Results are expressed as mean (µM choline or TMA) ± SEM (n = 6), and for choline, time-matched choline concentrations in the background (0 µM choline) are subtracted from choline-supplemented conditions. Areas under the curve (AUCs) from choline (C) and TMA (D) fermentations. Results are expressed as mean (h × µM of choline or TMA) ± SEM (n = 6), and for choline, time-matched choline concentrations in the background (0 µM choline) are subtracted from choline-supplemented conditions. Different letters indicate statistical differences (p < 0.05) by two-way ((A,B) main effect of DMB concentration) or one-way (C,D) ANOVA (Tukey’s post hoc test). Factors for two-way ANOVA were DMB concentration and time.

