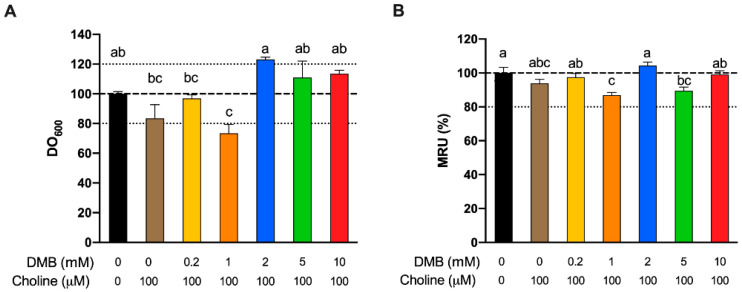
Figure 6.
Relative approximate cell count (600 nm optical density) fermentations at 24 h as a % of DMB-free choline-free conditions (A). Relative changes in mitochondrial respiration units (MRU) at 24 h as a % of DMB-free choline-free conditions (B). All fermentations were carried out with fecal slurry 20%. Results are expressed as mean (%) ± SEM (n = 6). Different letters indicate statistical differences (p < 0.05) by one-way ANOVA (Tukey’s post hoc test).

