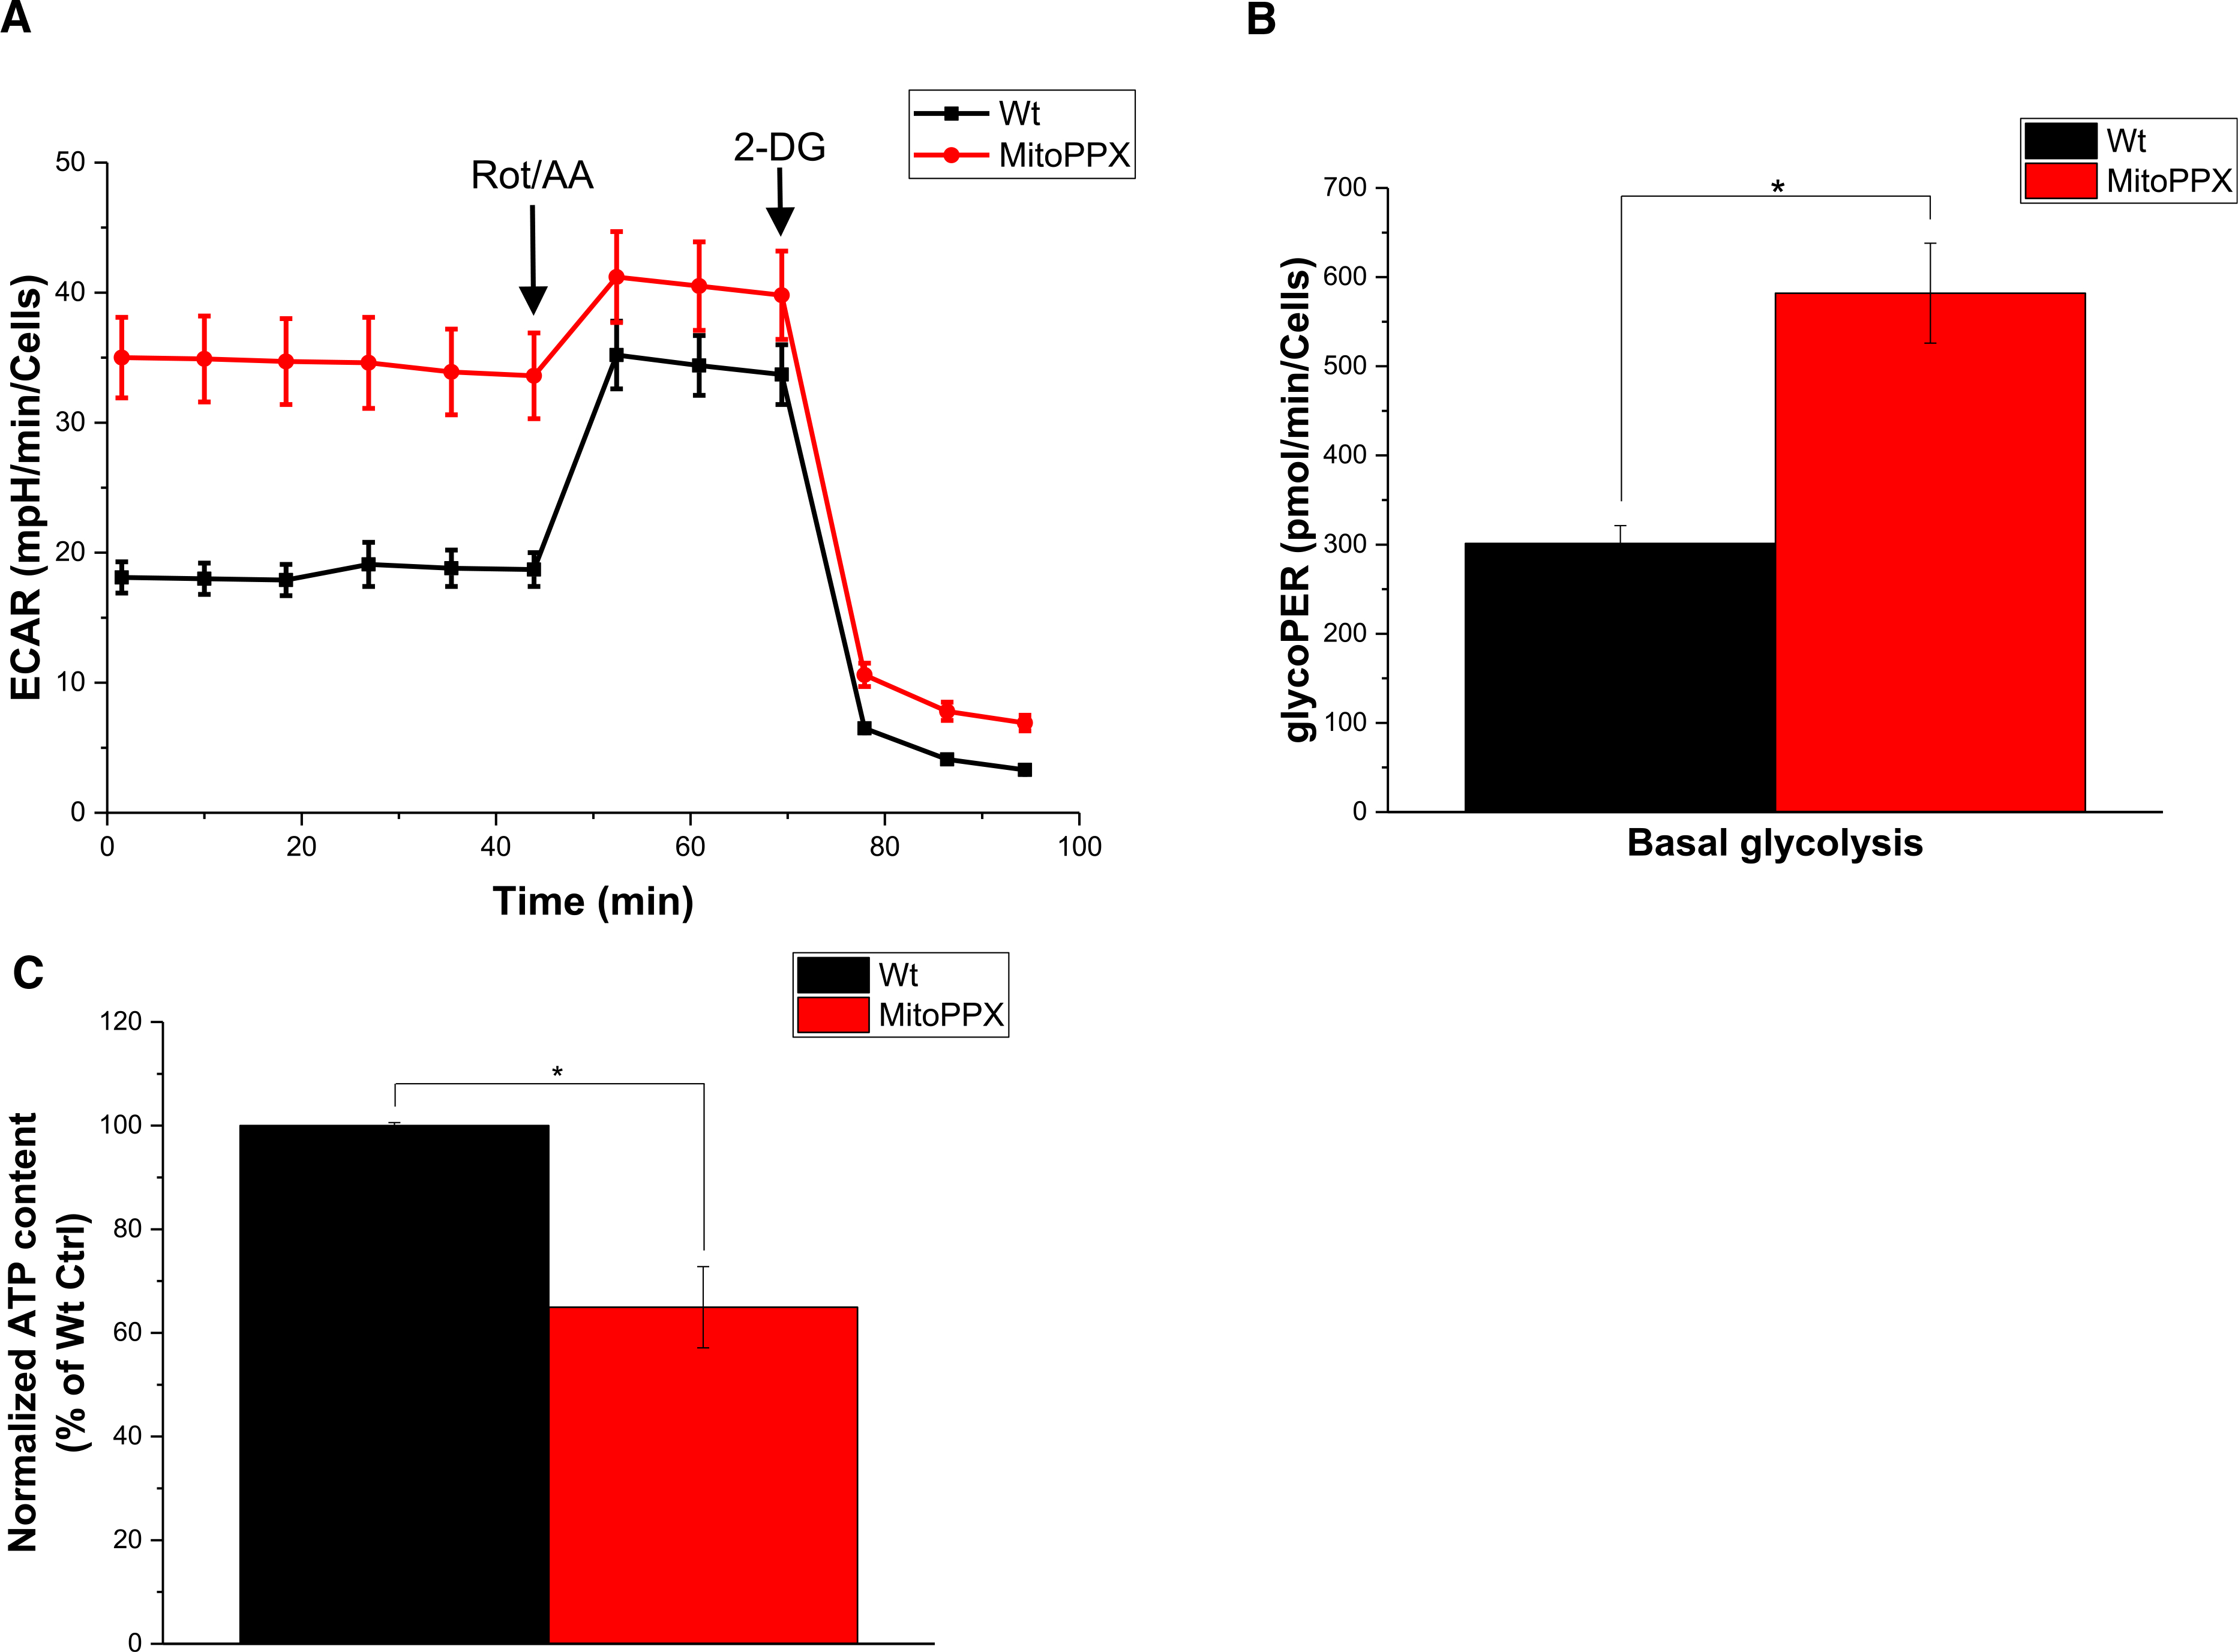
Figure 2. MitoPPX cells show increased glycolysis compared with Wt cells.

(A) Analysis of the glycolysis rate in Wt and MitoPPX HEK 293 cells using the Glycolytic Rate Assay Kit and Seahorse technology. Each experiment was conducted in biological triplicates and a representative graph is shown. (B) Quantification of the data shown in A. (C) Quantification of cellular ATP levels in Wt and MitoPPX cells. Data in the graphs is shown as average ± SEM.
