. 2019 Nov 26;11(3):713–720. doi: 10.1039/c9sc04773e

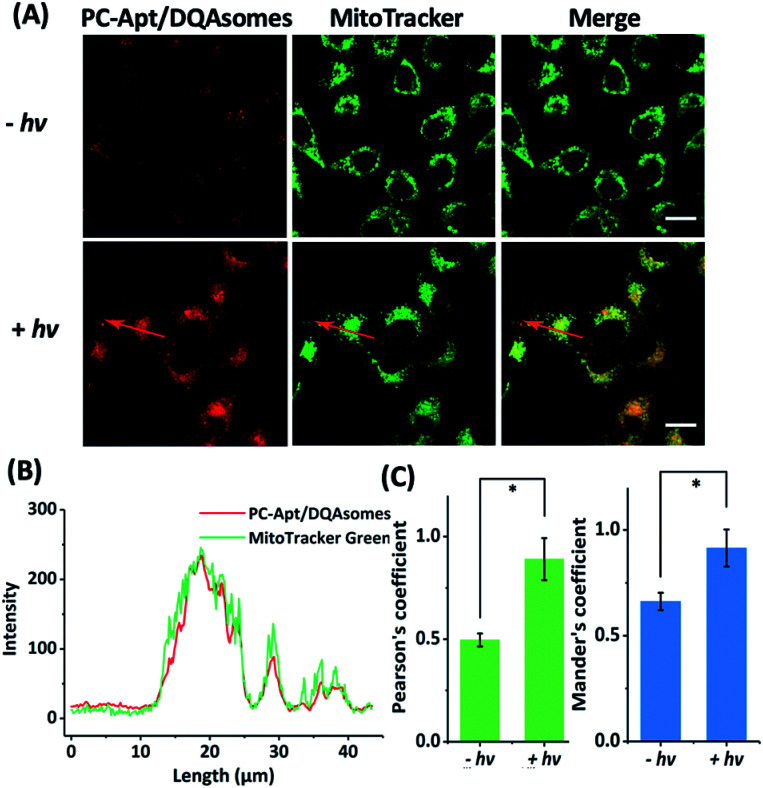
Fig. 4. Confocal microscopy of human cells transfected with PC-Apt/DQAsome complexes. (A) Confocal microscopy of HeLa cells transfected with PC-Apt/DQAsomes (red) with (+hv) or without (−hv) 365 nm light irradiation. MitoTracker Green is used for visualization of the mitochondrial network (green). (B) Fluorescence intensity profile of regions of interest (red arrow in A). (C) Co-localization coefficient performance with (+hv) or without (−hv) light irradiation, which is analyzed by Pearson's correlation coefficient (indicating the correlation between PC-Apt/DQAsomes and mitochondrial signals) and by Mander's coefficient (representing the proportion of the PC-Apt/DQAsome signal overlapping with mitochondria). Scale bar 20 μm. *p < 0.05.

Fig. 4