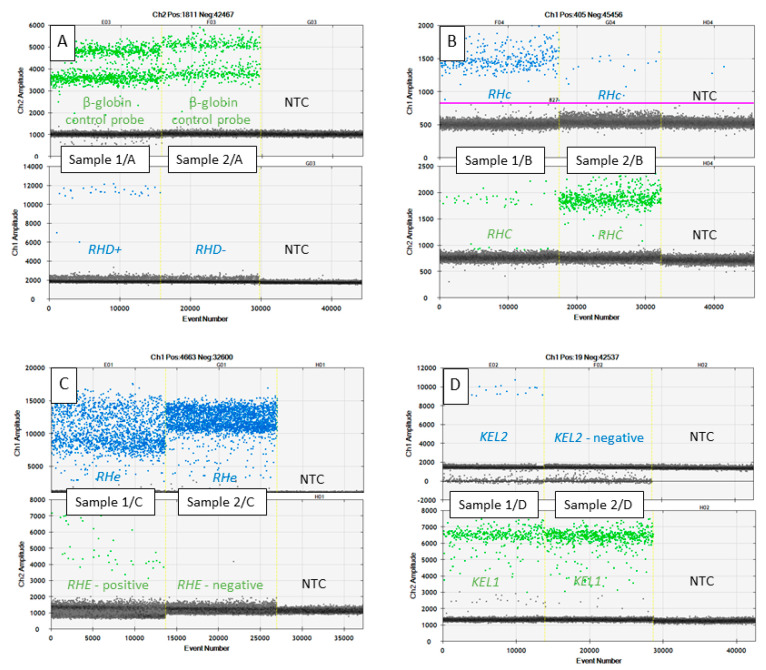
Figure 1.
Graphical outputs from one dimensional graph between the fluorescence intensity (y-axis) and droplet number (x-axis) of RHD, RHCE, and KEL genotyping from maternal cell-free plasma DNA; (A) green channel indicates plasma DNA control β-globin amplification, blue channel indicates RHD exon 7 positive droplets originate from the fetus. Maternal genotype in Sample 1/A is RHD−/RHD− while the fetal genotype is RHD+/RHD−, maternal genotype is RHD−/RHD− and the fetal genotype is also RHD−/RHD− in Sample 2/A; (B) blue channel positive droplets indicate variant RHc and green channel indicates RHC variants, maternal genotype in Sample 1/B is RHcc while fetal genotype is RHCc, maternal genotype is RHCC and fetal genotype is RHCc in Sample 2/B. In the case of RHc measurements, the QuantaSoft software was not able to set the cut-off line so it had to be done manually. Therefore, the purple cutoff line is visible; (C) green channel positive droplets indicate variant RHE, blue channel positive droplets indicate variant RHe. Plasma DNA sample 1/C contains both the maternal RHee genotype and different RHEe fetal genotype. The same genotypes RHee (maternal and fetal) are shown in the sample 2/C; (D) blue channel positive droplets indicate KEL1 variant, green channel positive droplets indicate KEL2 variant. Plasma DNA sample 1/D contains both the maternal KEL2/KEL2 genotype and different KEL1/KEL2 fetal genotype. Sample 2/D illustrates the same KEL2/KEL2 genotypes. NTC: Non-template control.

