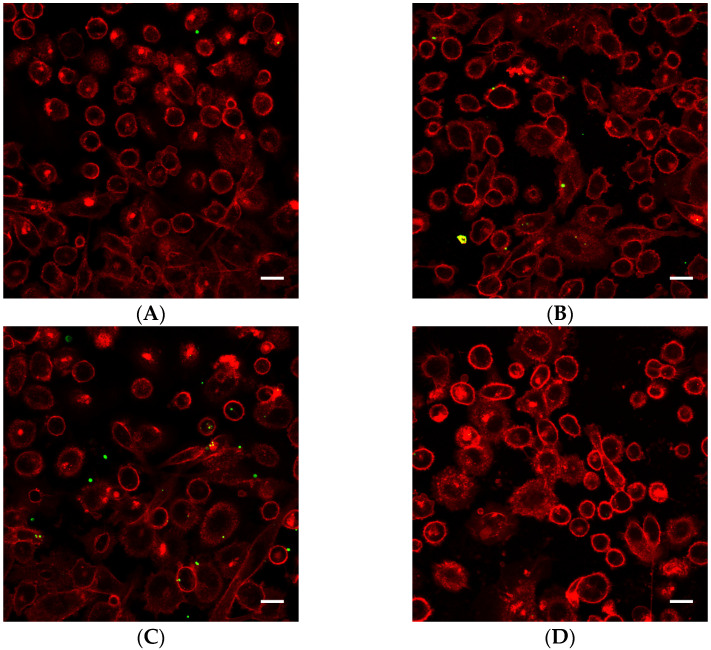
Figure 4.
Representative overview confocal images of PC3 cells showing Cell Masks (red) and nanoparticles (green) both on the surface and inside the cells. In addition to the free nanoparticles, the cells were treated with (A) nanoparticle-loaded microbubbles but no ultrasound at 37 °C (control), (B) nanoparticle-loaded microbubbles and ultrasound at 4 °C, (C) nanoparticle-loaded microbubbles and ultrasound at 37 °C or (D) Sonazoid and ultrasound at 37 °C. The scale bars are 20 µm.

