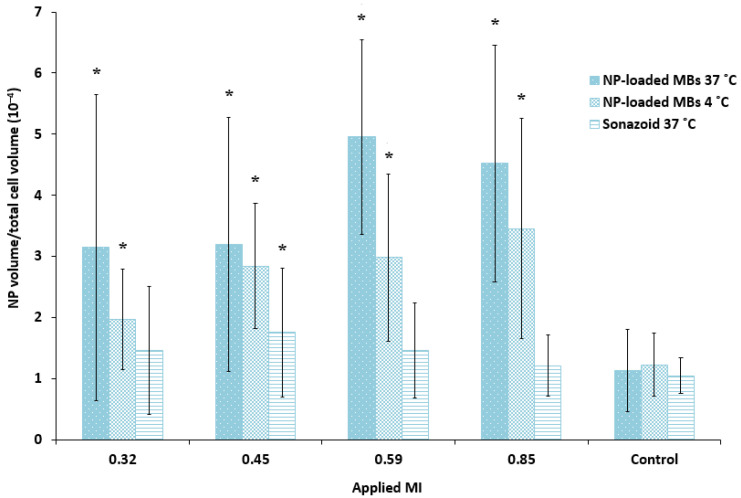
Figure 6.
Quantitative comparison of the cellular uptake of nanoparticles (NP) after ultrasound treatment of various MIs using nanoparticle-loaded bubbles (NP-loaded MBs) at 37 °C and 4 °C, compared to the lipid Sonazoid microbubbles at 37 °C. Data show the total number of nanoparticle voxels relative to the total number of cell voxels in the z-stack (nanoparticles both inside cells and colocalized with the cell membrane are included). Averages and the standard deviation are shown from n = 17–18 z-stacks at 37 °C and n = 8–9 at 4 °C, and * indicates significant differences (p < 0.05) compared to the untreated control cells.

