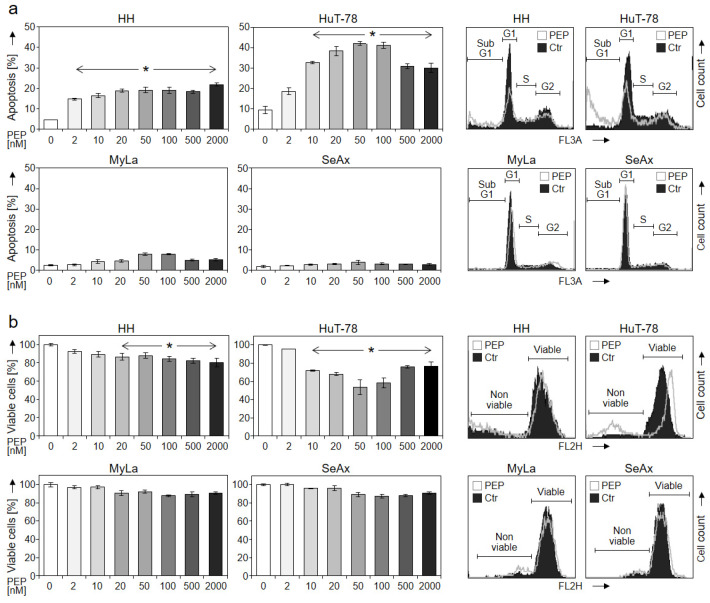
Figure 1.
Dose dependency of induced apoptosis and decreased cell viability. Apoptotic rates (propidiumiodide staining, a) and cell viability (calcein staining, b) were determined in four CTCL cell lines (HH, HuT-78, MyLa and SeAx) treated for 48 h with increasing concentrations of PEP005 (2, 10, 20, 50, 100, 500, 2000 nM). Apoptotic rates correspond to percentages of cells with fragmented DNA, which were determined as sub-G1 cells. Cell viability values are shown in relation to non-treated controls, which were set to 100%. Characteristic histograms of cells treated with 50 nM PEP005 (PEP) are shown on the right side in overlays with control cells (Ctr). Cell populations in cell cycle phases G1, S, G2 and sub-G1 cells as well as viable and non-viable cells are indicated in (a,b), respectively. Mean values of triplicates ± SDs of representative experiments are shown. At least two independent experiments (each one with triplicates) revealed highly similar data. Statistical significance was calculated from all values (at least 6) and is shown for treated cells vs. controls (* p < 0.05).

