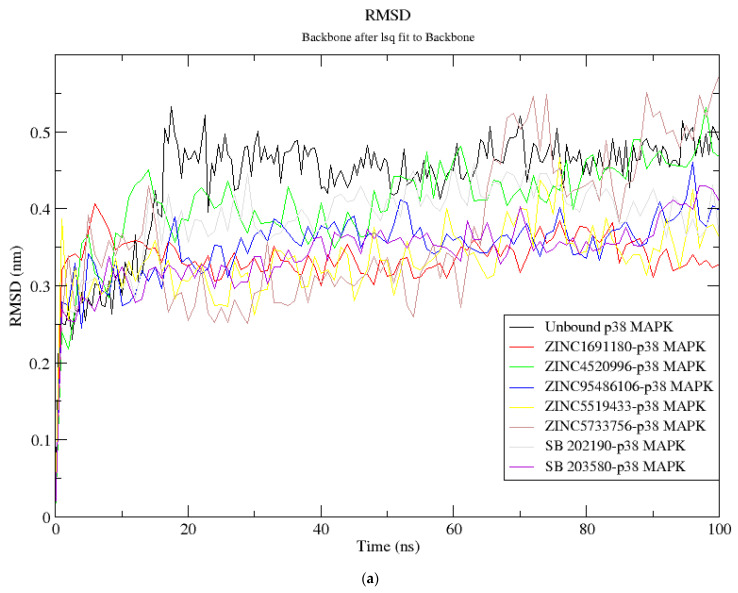
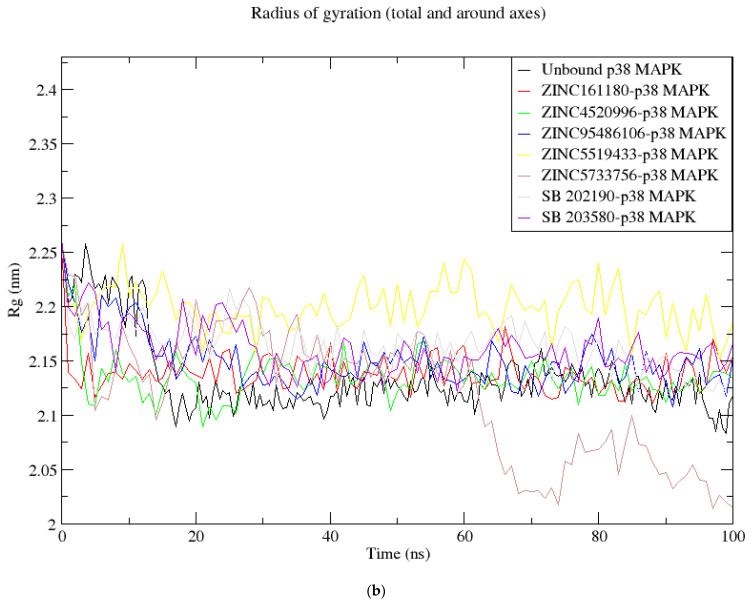
Figure 4.
Molecular dynamics simulations graphs (a) RMSD versus time (ns) and (b) Rg versus time (ns). In (a,b), the unbound p38 MAPK protein (3ZS5), ZINC1691180, ZINC4520996, ZINC5519433, and ZINC5733756, SB 202190, and SB 203580–p38 MAPK complexes are shown as black, red, green, blue, yellow, brown, ash and purple, respectively.


