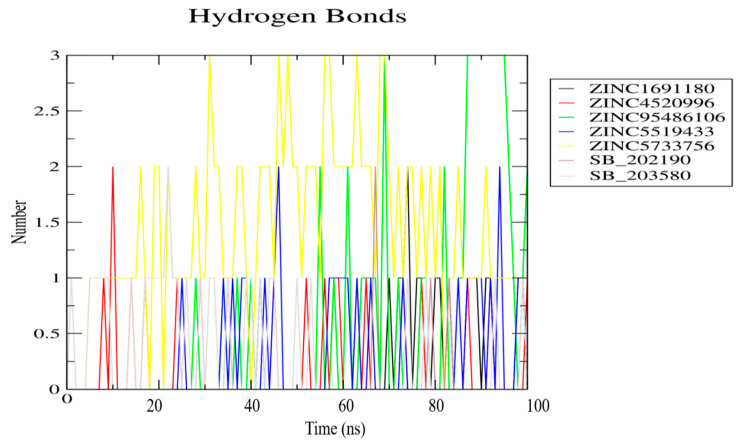
Figure 6.
The total number of hydrogen bonds formed between the selected compounds and the protein structure. ZINC1691180, ZINC4520996, ZINC95486106, ZINC5519433, ZINC5733756, SB 202190, and SB 203580-p38 MAPK complexes are represented as black, red, green, blue, yellow, brown and ash, respectively.

