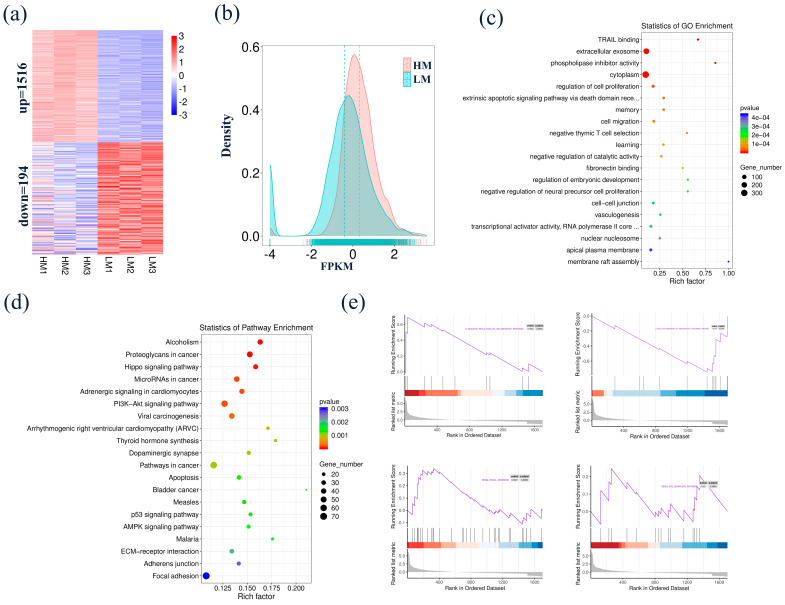
Figure 4.
Identification and functional analysis of DEGs in blastocyst-stage embryo. (a) Comparing HM with LM, a total of 1710 DEGs were identified, including 1515 up-regulated and 194 down-regulated DEGs. (b) Density plot of FPKM between HM and LM. (c,d) The GO and KEGG enrichment analyses of the DEGs. (e) The DEGs were enriched in negative thymic T cell selection, p53 signaling pathway, and focal adhesion.

