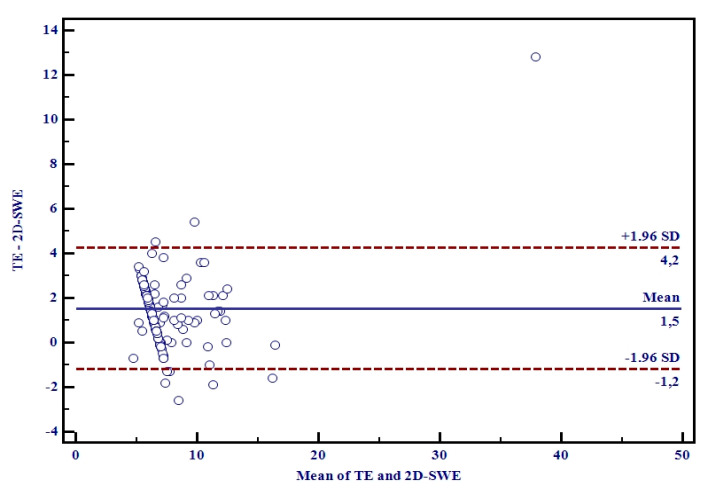
Figure 4.
Bland-Altman plots of differences between TE and 2D-SWE.PLUS measurements. The solid line represents the mean of the difference between the elastography measurements taken with the two techniques; the dashed lines define the limit of agreement: the mean difference is 1.5 ± 0.35. The 95% upper and lower LOA were 4.2 and −1.2, respectively.

