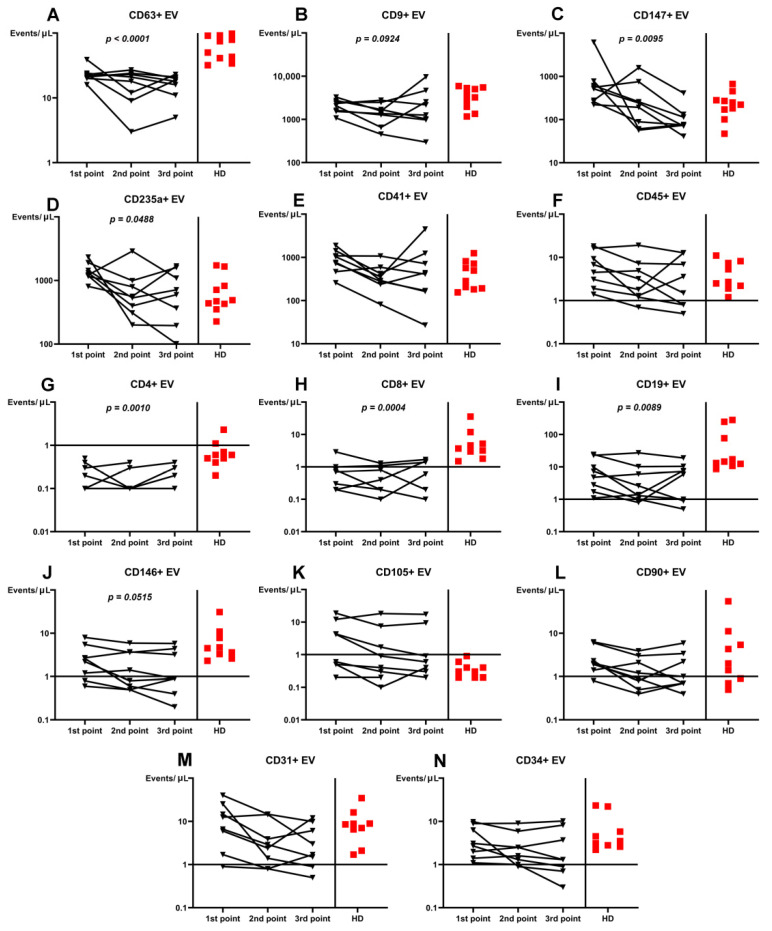
Figure 2.
Dynamics in plasma concentration of extracellular vesicles (EVs) in COVID-19 patients during the treatment compared with healthy donors (HD). (A). CD63+ EV. (B). CD9+ EV. (C). CD147+ EV. (D). CD235a+ EV. (E). CD41+ EV. (F). CD45+ EV. (G). CD4+ EV. (H). CD8+ EV. (I). CD19+ EV. (J). CD146+ EV. (K). CD105+ EV. (L). CD90+ EV. (M). CD31+ EV. (N). CD34+ EV. Results represented in log10 scale.

