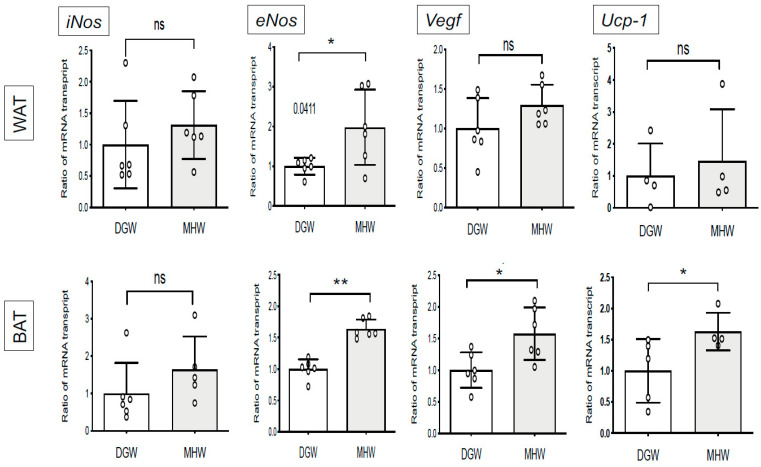
Figure 4.
The genes expressed in BAT of DIO mice drinking MHW vs DGW for 2 weeks. Y-axis indicates the transcriptional ratio of expressing genes (eNos, Vegf, or Ucp-1) in WAT or BAT of DIO mice drinking MHW compared with DGW. The bar graphs show mean ± SD. * p < 0.05, ** p < 0.01; ns, not significant.

