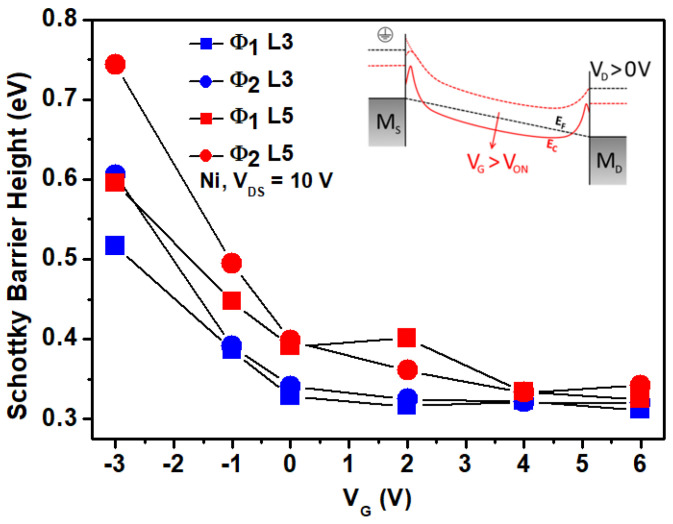
Figure 8.
Schottky barrier height for both source and drain Ni contact with ZnO NP, as a function of the gate voltage VG. As VG increased for positive values, the Schottky effect was more prominent and thus reduced the SBH. The inset figure represents the band diagram of an MSM structure under different gate voltages, elucidating the Schottky effect.

