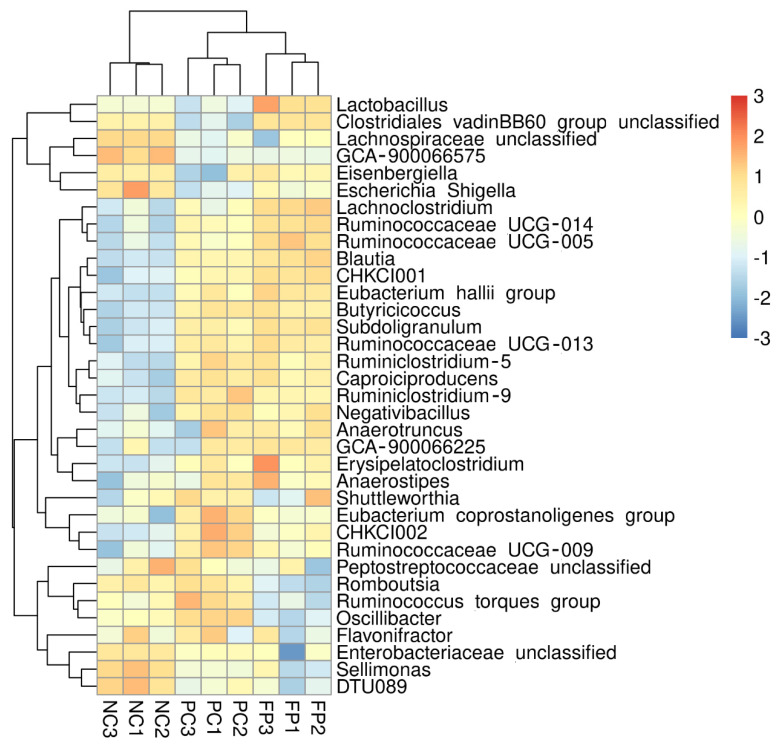
Figure 2.
Taxonomic composition analysis of cecal digesta. A heatmap showing the dominant 35 genera (y-axis) across different treatment groups (x-axis, basal diet without treatment (NC), basal diet plus coccidial challenge (PC), and basal diet plus the coccidial challenge and 1 g/kg of B. licheniformis-fermented products (FP), n = 3).

