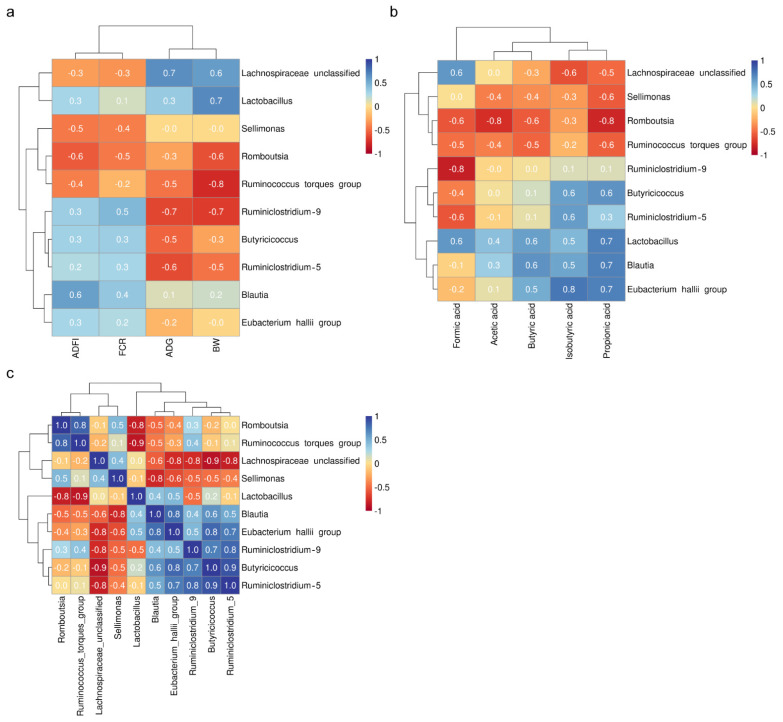
Figure 3.
Pearson’s correlation analysis. (a) The correlation coefficient between the dominant 10 genera and cecal short-chain fatty acid. (b) The correlation coefficient between the dominant 10 genera and growth performance of broilers. ADFI: average daily feed intake, FCR: feed conversion ratio, ADG: average daily gain, BW: body weight. (c) The correlation coefficient among the dominant 10 genera. The positive correlations are shown in blue, while the negative correlations are shown in red. The color intensity and the size of the circle are proportional to the correlation coefficients. The values from +1 to −1 indicate the strength of the association.

