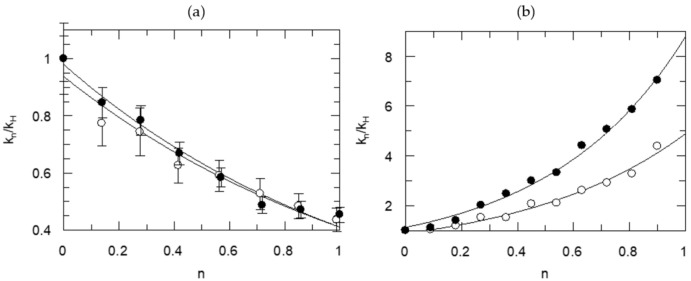
Figure 4.
Proton inventory for the thrombin-catalyzed fibrinogen hydrolysis at conditions indicated in Figure 3. (a) Left side: open circles, initial rates at 22 μM fibrinogen and the equation of the line is kn/kH = 0.90 (1 − n + n/1.51)2; filled circles, pseudo-first-order data at 0.55 μM fibrinogen and the equation of the line is kn/kH = 0.98 (1 − n + n/1.56)2. (b) Right side: proton inventory for the evolution of turbidity during fibrin formation. Open circles represent inverse partial solvent isotope effects for the inverse lag (life) time and the line was calculated from τn/τH = 0.88 (±0.06) [5.55(±0.52)]n Closed circles are for the maximal slopes of turbidity plots and the line was calculated from slopen/slopeH, a = 1.13 (±0.06)[7.79 (±0.56)]n Errors are within the symbols.

