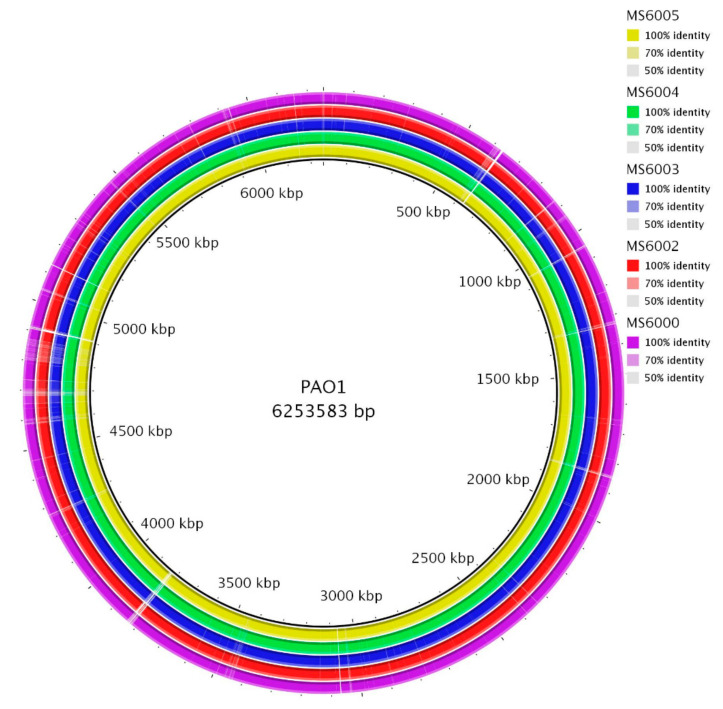
Figure 1.
Circular representation of the CF P. aeruginosa isolates genomes. Comparison was performed using the blast ring image generator (BRIG) software [14]. Each genome is represented by a ring with different colors shown in the legend at the upper right panels. The genome of P. aeruginosa PAO1 (GenBank: JIEO00000000.1) was used as a reference sequence, represented in the innermost ring. The second innermost ring shows MS6005 genome and followed by isolates MS6004, MS6003, MS6002 and MS6000.

