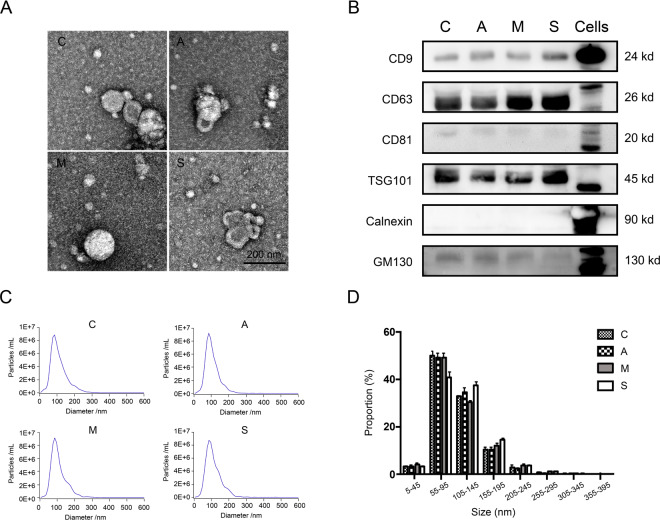
Fig. 2. Verification of EVs sample quality.
A The typical circular morphology of EVs was observed under electron microscope (EM) from groups C, A, M, and S. B Western blot was used to analyze the EV marker proteins CD9, CD64 and CD81, TSG101, non-EV marker Calnexin and GM130 in groups C, A, M, S, and Cells. Each well was loaded with 20 μg protein. C, D The size distribution curve and distribution proportion of EVs in plasma of C, A, M, and S were shown by NTA analysis. The diameter of EVs in these four groups was mostly concentrated in the interval of 55–145 nm, and the data were shown with mean + SD. There was no significant difference in the proportion of groups C, A, M, and S in each distribution interval (P > 0.05).

