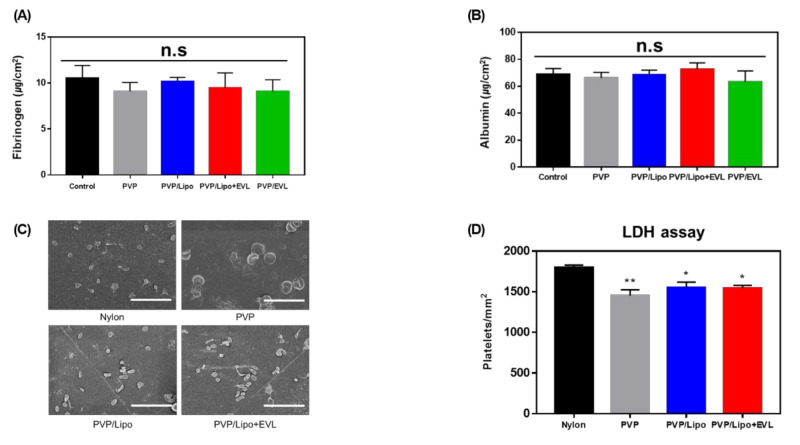
Figure 7.
Hemocompatibility test. The degree of protein adsorption of (A) Fibrinogen and (B) Albumin depending on various coated layers (Control means bare Nylon tubes). (C) SEM images for platelet adhesion incubating with coated materials (Scale bars equal to 20 μm). (D) LDH assay to evaluate platelet adhesion onto coated materials. Values are presented as mean ± SD (n = 3) and statistical significance was obtained with one-way analysis of ANOVA with Tukey’s multiple comparison post-test (* p < 0.05; ** p < 0.01).

