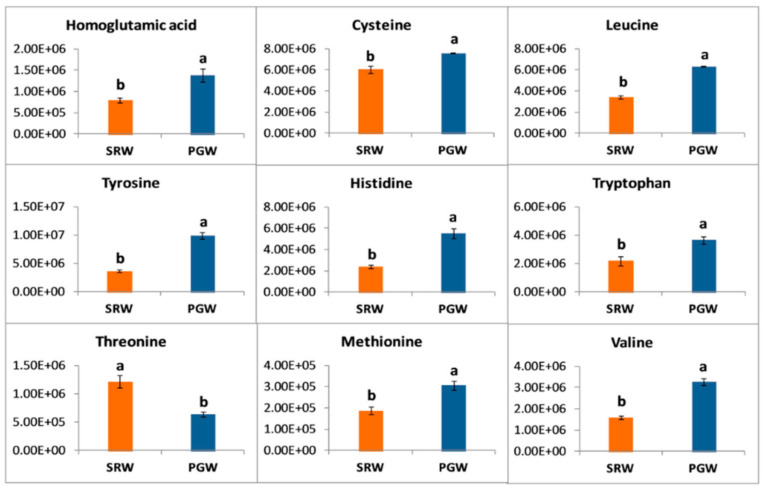
Figure 5.
Y-axis shows the differences in relative contents of amino acids between mature fruit of pumpkin-grafted watermelon (PGW) and self-rooted watermelon (SRW). Vertical bars represent standard error among three independent replicates. Data are the mean ± SE of three replicates. Different lowercase letters indicate significant differences at p < 0.05.

