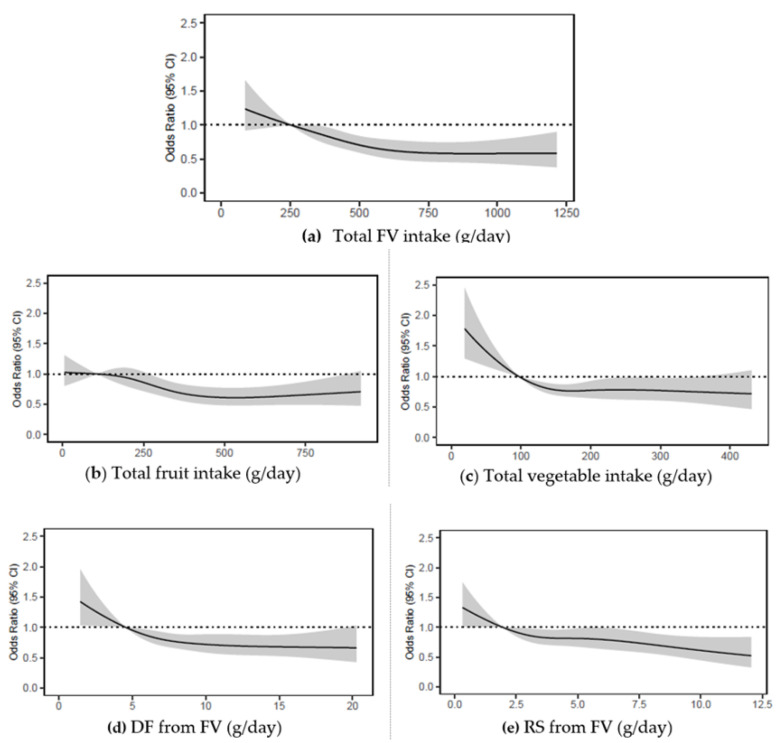
Figure 3.
Odds ratios from logistic regression models with restricted cubic spline curves describing the association of baseline intakes of (a) FV combined, (b) fruits, (c) vegetables, (d) DF from FV, (e) RS from FV in g/day, with 5-year MCS scores (vertical axis) in 4067 Australian adults from the AusDiab study (excludes those with baseline MCS score < 47). Odds ratios are based on models adjusting for age, sex, BMI, energy intake, relationship status, physical activity, level of education, the socio-economic index for areas (SEIFA), smoking status, diabetes status, and self-reported history of CVD, and are comparing the specific level of intake (horizontal axis) to the median (IQR) intake for participants in the lowest intake quartile (FV combined: 251 g/day; fruits: 106 g/day; vegetables: 97 g/day); DF from FV: 5 g/day; RS from FV: 2 g/day. DF, dietary fibre; FV, fruit and vegetables combined; MCS, SF-36 Quality of Life Scale—Australian norm-based mental component score median; RS, resistant starch.

