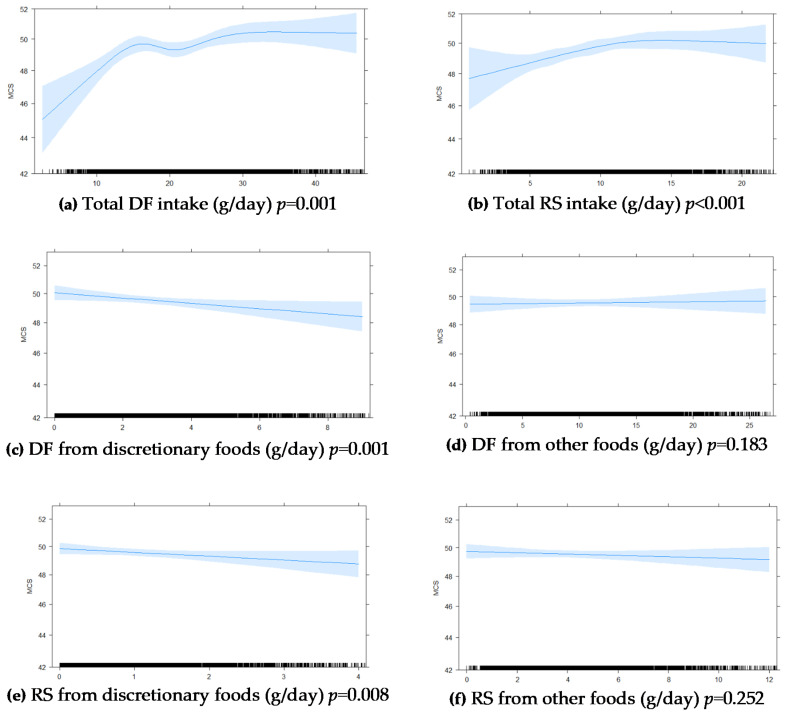
Figure A1.
Graphic presentation from multivariable-adjusted general linear models of the longitudinal relationship between baseline intakes of (a) total DF, (b) total RS, (c) DF from discretionary foods, (d) DF from other foods, (e) RS from discretionary foods, (f) RS from other foods in (g/day), with 5 year MCS scores in 5845 Australian adults from the AusDiab study. Models were adjusted for age, sex, BMI, energy intake, relationship status, physical activity, level of education, the socio-economic index for areas (SEIFA), diabetes and self-reported prevalence of CVD. The blue shaded areas represent 95% CI, the rug plot along the bottom of each graph represents each dietary intake observation. DF, dietary fibre; FV, fruit and vegetables combined; MCS, SF-36 Quality of Life Scale—Australian norm-based mental component score median; RS, resistant starch.

