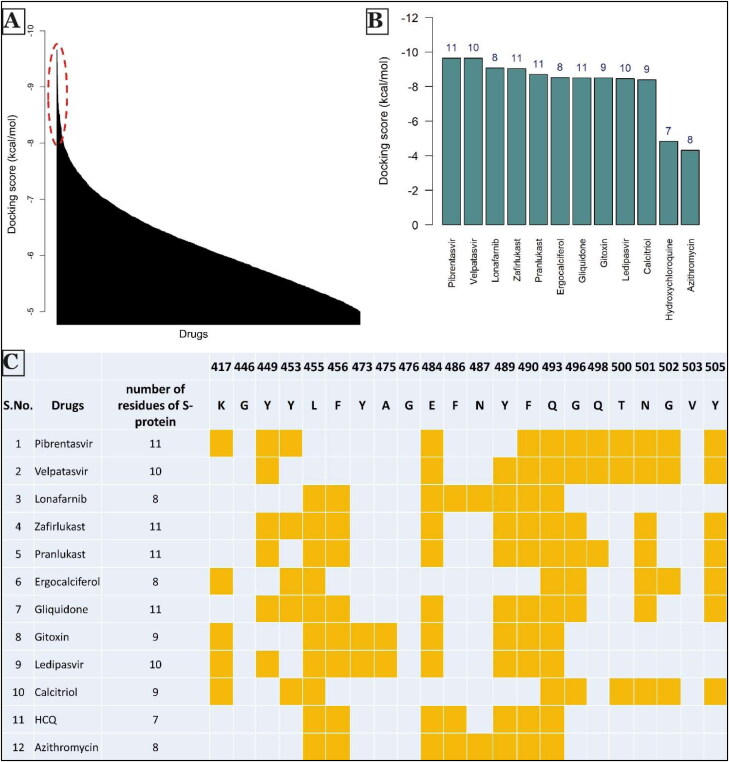
Figure 2.
Summary of screening of drugs against SARS-CoV-2 S protein. (A) Docking score distribution of all drugs (in descending order) with a threshold of −5 kcal/mol. Drugs with docking score less than −8.4 Kcal/mol were considered for secondary analysis. (shown by ellipse in dotted red line.) (B) Barplot of the docking score of selected drugs. Values at the top of bins denote the number of residues of S protein to which both human ACE2 receptor and drugs are interacting. (C) Secondary screening results of selected drugs. The second column shows the number of S-protein residues to which both hACE2 and each of the mentioned drugs interact. The highlighted orange colored cell shows the S protein residues (with residue numbers on top) to which both hACE2 and drugs interact. Hydroxychloroquine (HCQ) and azithromycin were chosen as molecules for comparison with the other potential drugs.

