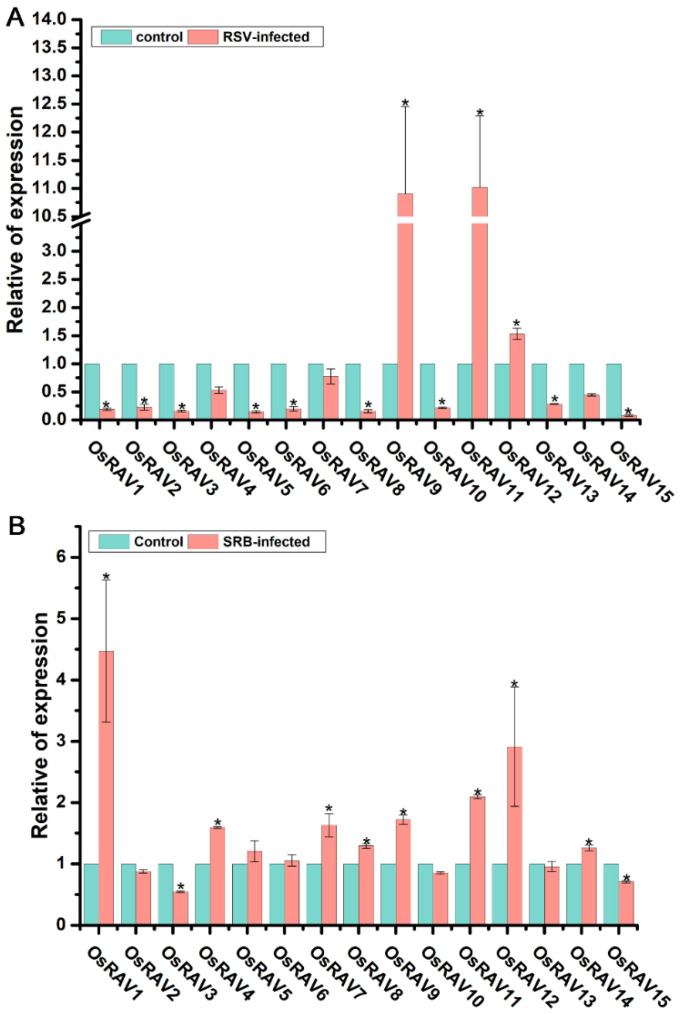
Figure 8.
Relative expression level of fifteen RAV genes in response to RSV (A) and SRBSDV (B) infection. RNA was extracted from RSV-infected plants at 30 dpi and from SRBSDV-infected plants at 90 dpi. qPCR data are shown as relative expression levels of virus-infected plants in comparison with the mock control plants and normalized using OsUBQ5. Results are the means ± standard deviation (SD) of three biological replicates. * indicates significant difference between virus free and infected at p ≤ 0.05 by Fisher’s least significant difference tests.

