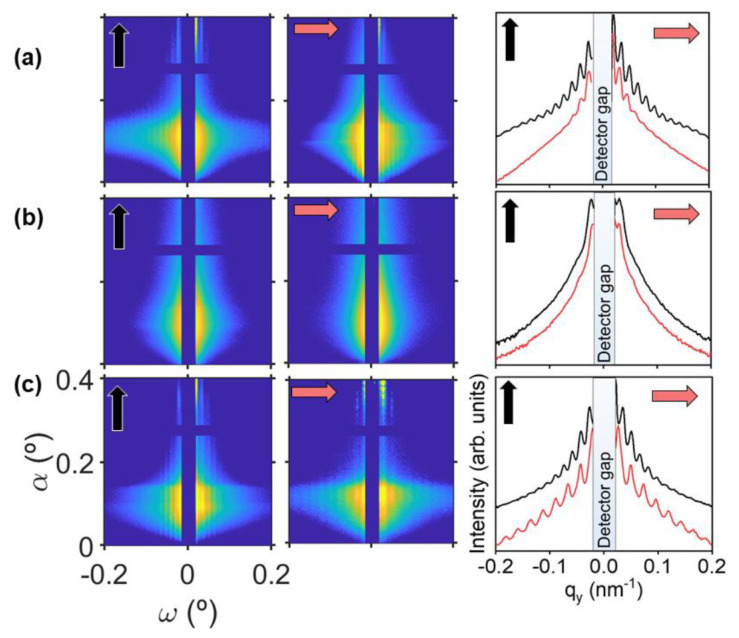
Figure 2.
GISAXS patterns from P3HT irradiated samples with (a) squares of ~500 nm, (b) squares of ~200 nm and (c) rectangles of ~500 nm × ~200 nm. Left column: GISAXS patterns taken with the X-ray beam parallel to the first irradiation direction. Center column: GISAXS patterns taken with the X-ray beam parallel to the second irradiation direction. Right column: horizontal cuts from their corresponding GISAXS patterns in the same row, left column (black curves) and center column (red curves). Black arrows indicate the direction of the first irradiation step and red arrows the direction of the second irradiation step. GISAXS patterns taken at incident angle α = 0.4°. Intensity in logarithmic scale.

